全文下载链接:http://tecdat.cn/?p=29480
作者:Xingsheng Yang
最近我们被客户要求撰写关于链家租房数据分析的研究报告,包括一些图形和统计输出。
1 利用 python 爬取链家网公开的租房数据;
2 对租房信息进行分析,主要对房租相关特征进行分析,并搭建模型用于预测房租
任务/目标
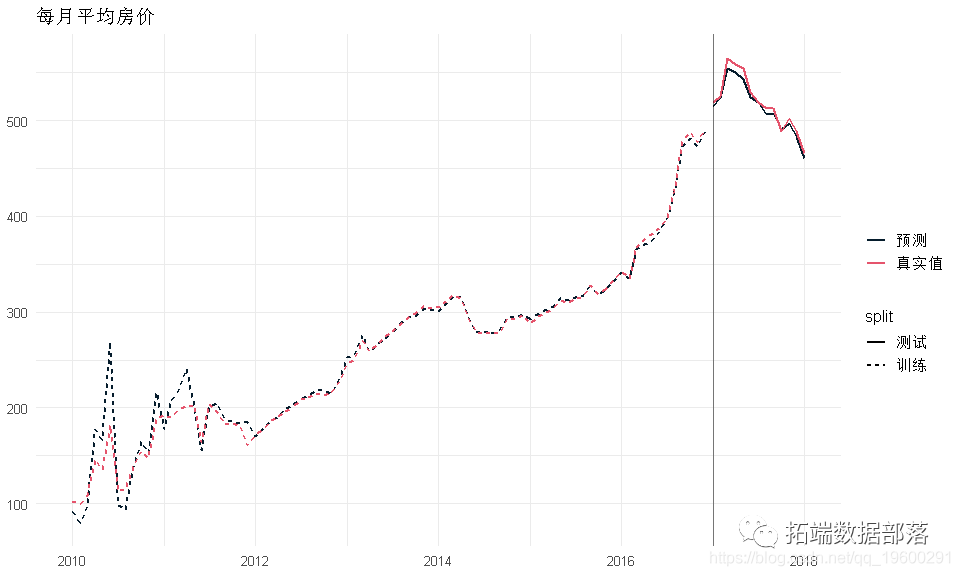
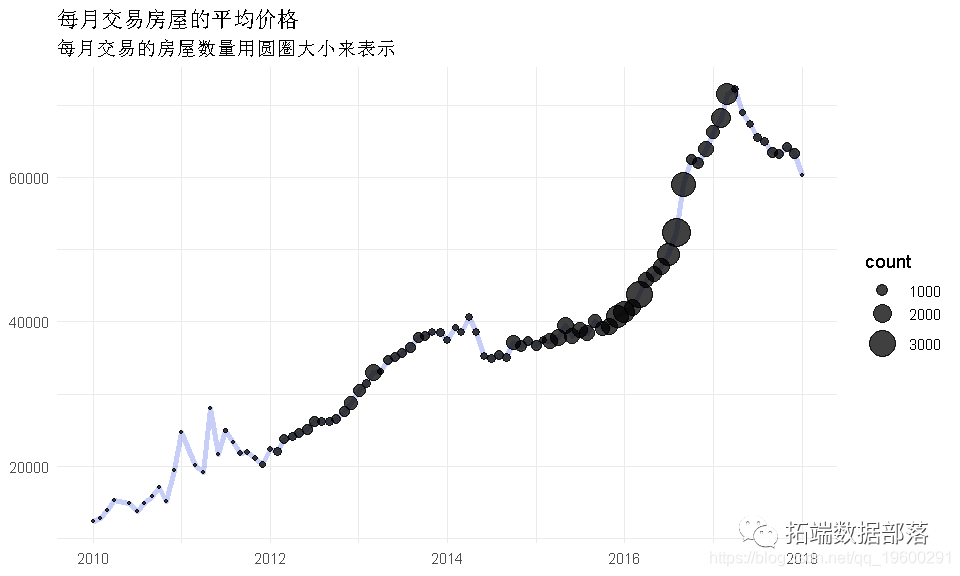
利用上海链家网站租房的公开信息,着重对月租进行数据分析和挖掘。
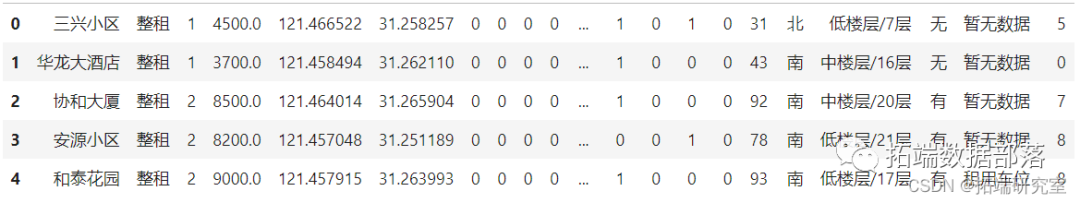
上海租赁数据
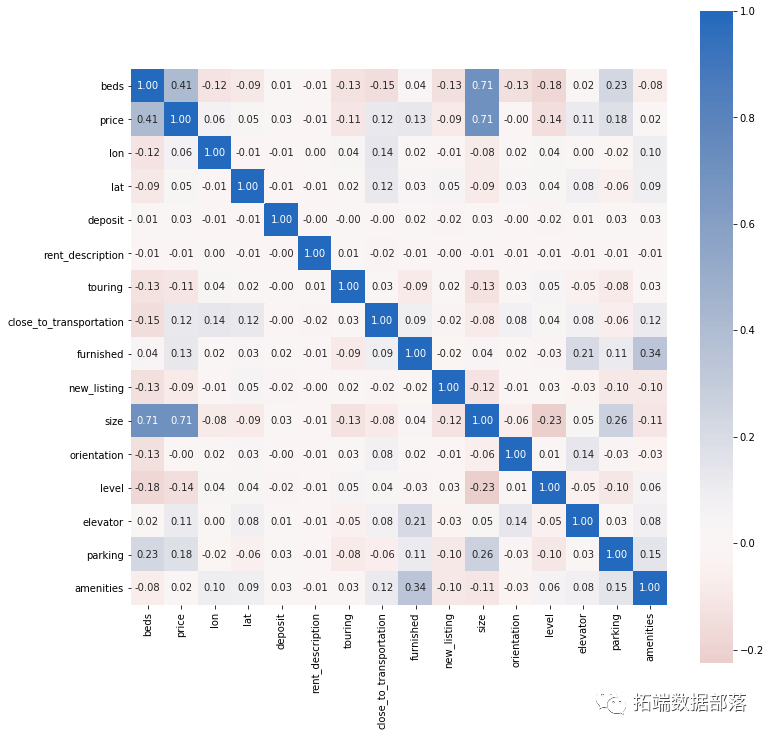
此数据来自 Lianjia.com.csv文件包含名称,租赁类型,床位数量,价格,经度,纬度,阳台,押金,公寓,描述,旅游,交通,独立浴室,家具,新房源,大小,方向,堤坝,电梯,停车场和便利设施信息。
属性:
名称:列表名称 类型:转租或全部租赁(全部) 床:卧室号码 价格 经度/纬度:坐标 阳台,押金(是否有押金政策),公寓,描述,旅游可用性,靠近交通,独立浴室,家具
新房源:NO-0,YES-1 面积:平方米 朝向:朝向窗户,南1,东南2,东-3,北4,西南-5,西-6,西北-7,东北8,未知-0 级别:房源层级, 地下室-0, 低层(1-15)-1, 中层(15-25)-2, 高层(>25)-3 停车场:无停车场-0,额外收费-1,免费停车-2 设施:设施数量
import pandas as pdimport numpy as np
import geopandas
df = pd.read_csv('lighai.csv', sep =',', encoding='utf_8_sig', header=None)
df.head()
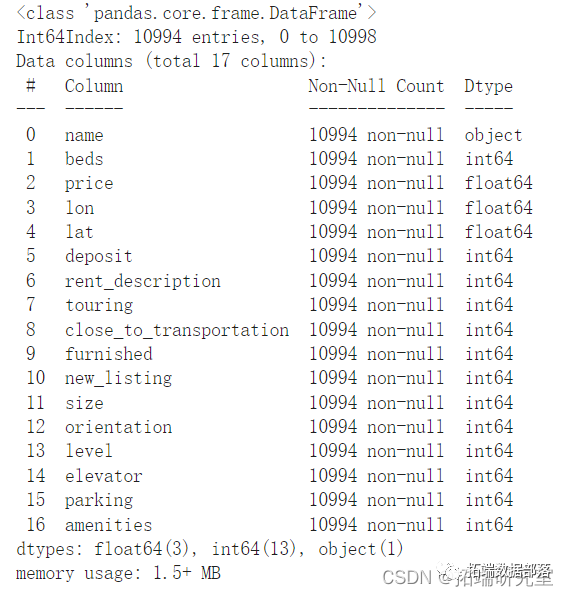
数据预处理
ETL处理,清理数据帧。
df_clean.head()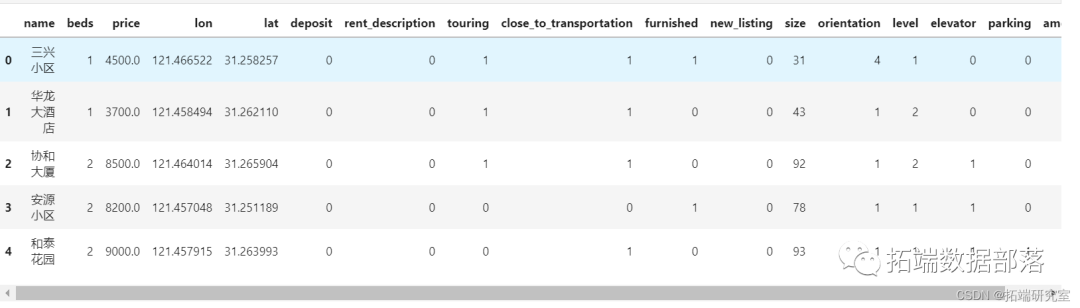
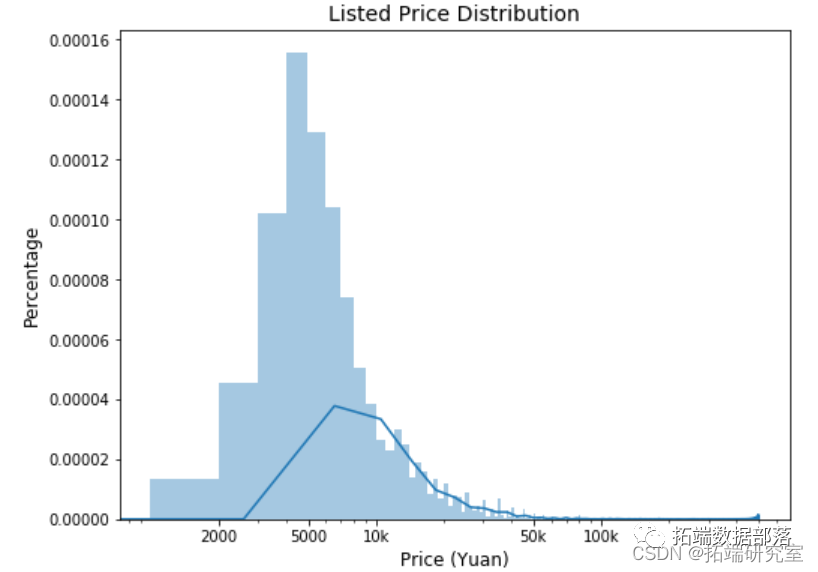
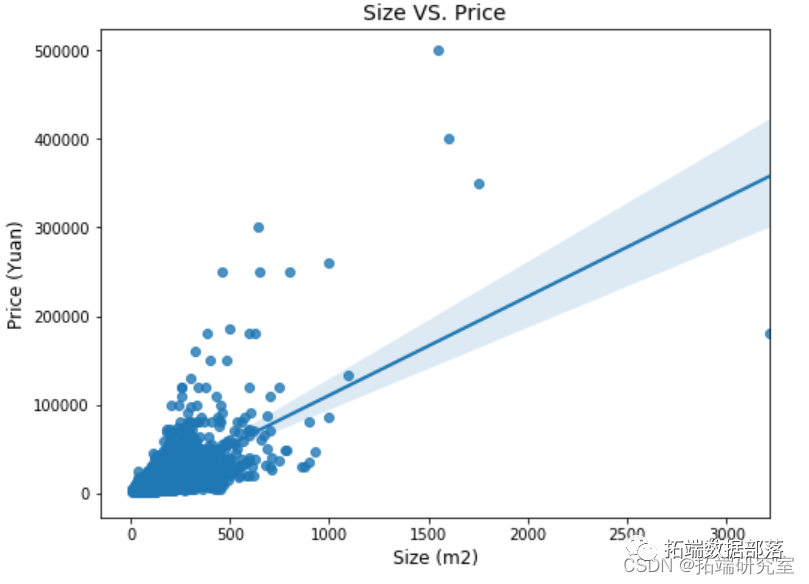
探索性分析 - 数据可视化
plt.figure(figsize=(8, 6))sns.distplot(df_clean.price, bins=500, kde=True)
plt.xscale('log') # Log transform the price
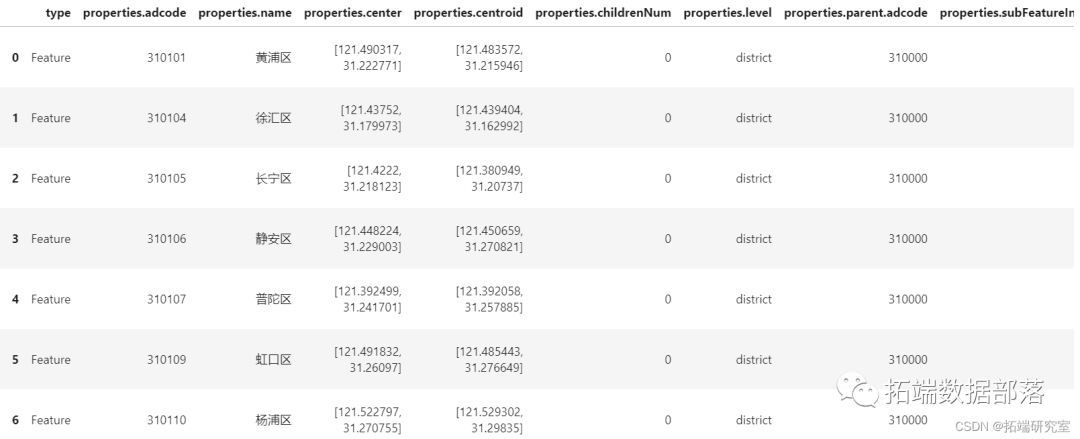
读取地理数据
plt.figure(figsize=(12, 12))
sns.heatmap(df_clean.corr(), square=True, annot=True, fmt = '.2f', cmap = 'vla
点击标题查阅往期内容
线性回归和时间序列分析北京房价影响因素可视化案例
左右滑动查看更多
01
02
03
04
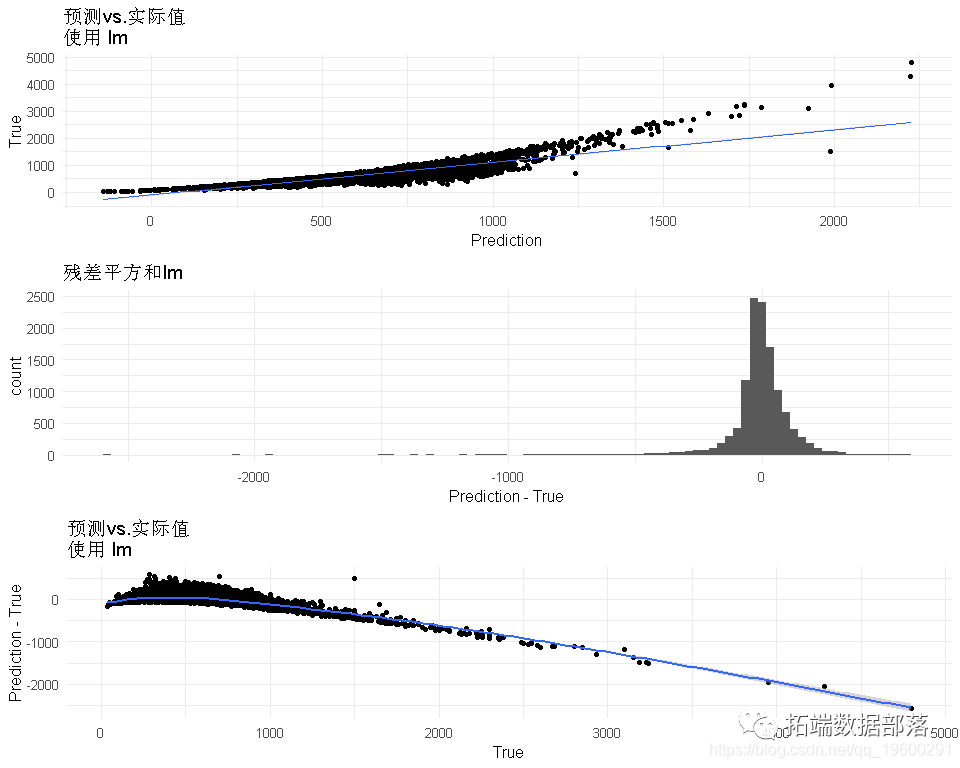
模型构建
尝试根据特征预测价格。
y = df_clean.log_price
X = df_clean.iloc[:, 1:].drop(['price', 'log_price'], axis=1)
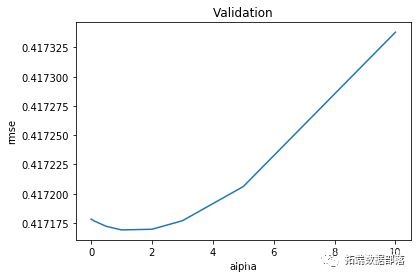
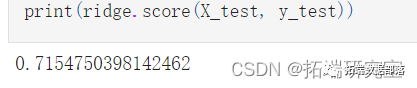
岭回归模型
ridge = Ridge()
alphas = [0.0001, 0.001, 0.001, 0.01, 0.1, 0.5, 1, 2, 3, 5, 10]
Lasso回归
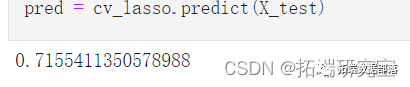

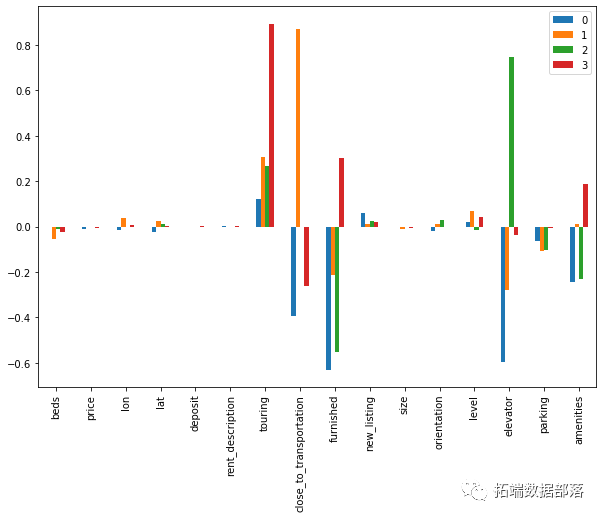
coef.sort_values(ascending=False).plot(kind = 'barh')
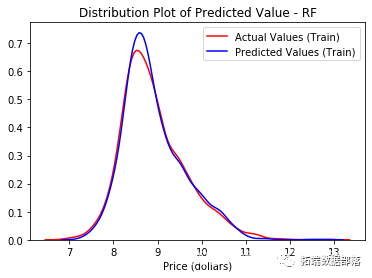
Random forest随机森林
rf_cv.fit(X_train, y_train)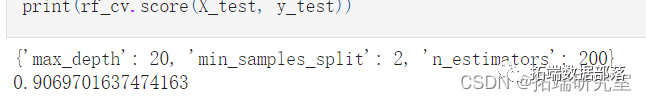
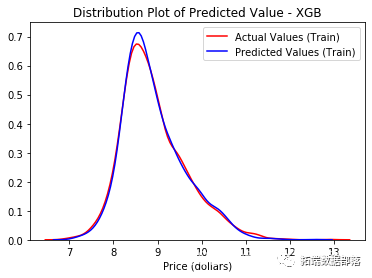
XGBoost
xgb_model.loc[30:,['test-rmse-mean', 'train-rmse-mean']].plot();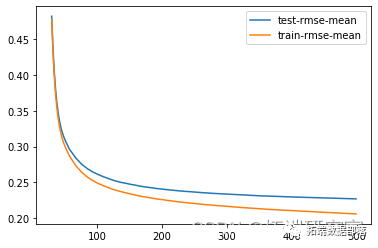
xgb_cv.fit(X_train, y_train)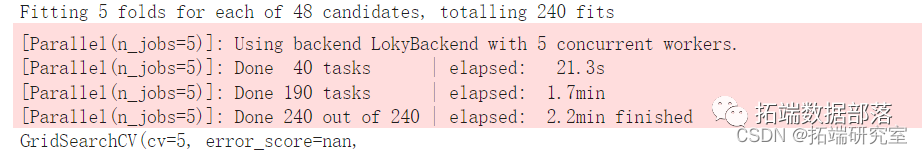

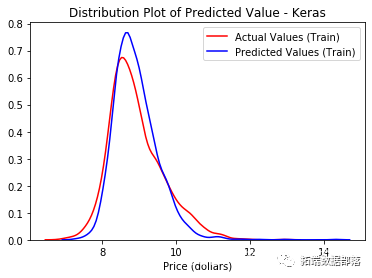
Keras神经网络
model.add(Dense(1, kernel_initializer='normal'))# Compile model
model.compile(loss='mean_squared_error', optimizer='Adam')
model.summary()

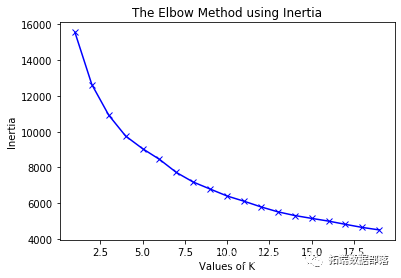
kmeans聚类数据
kmeanModel = KMeans(n_clusters=k).fit(X)kmeanModel.fit(X)
inertias.append(kmeanModel.inertia_)
plt.plot(K, inertias, 'bx-')
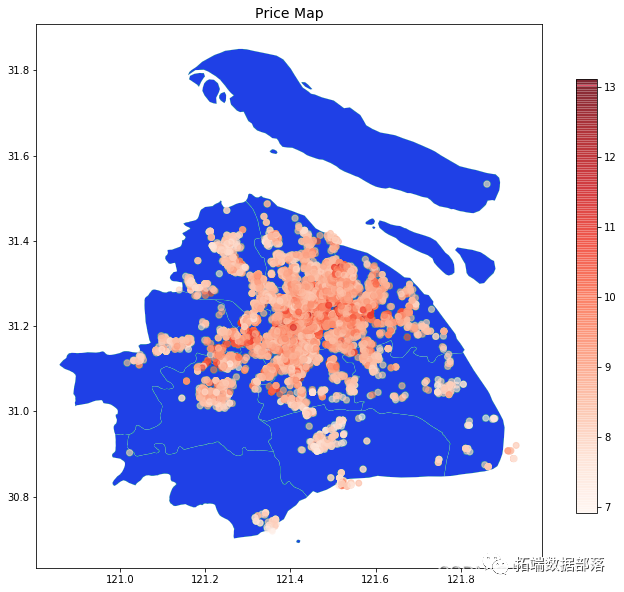
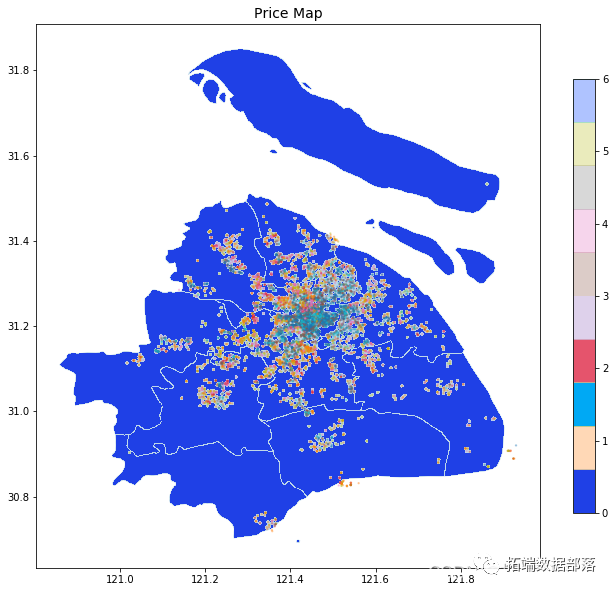
gpd.plot(figsize=(12,10), alpha=0.3)
scatter_map = plt.scatter(data=df_clean, x='lon', y='lat', c='label', alpha=0.3, cmap='tab10', s=2)
本文选自《python岭回归、Lasso、随机森林、XGBoost、Keras神经网络、kmeans聚类链家租房数据地理可视化分析》。