今天发现一个开源的python符号计算系统,正好对数值算法感兴趣,所以就做一番探索:

pip install sympy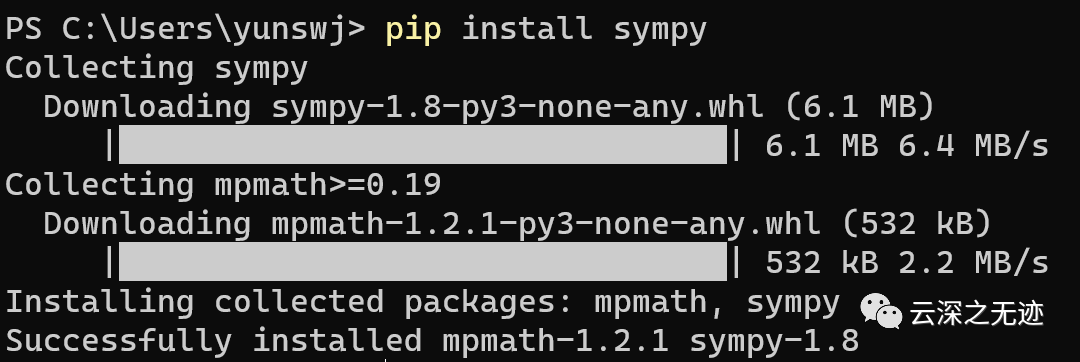
直接pip安装一下
https://github.com/sympy/sympyhttps://docs.sympy.org/latest/tutorial/preliminaries.html以上分别是GitHub的地址和相关的doc~

直接copy一份源码来研究
接下来使用一下:
以下老哥的demo很不错,直接使用了~
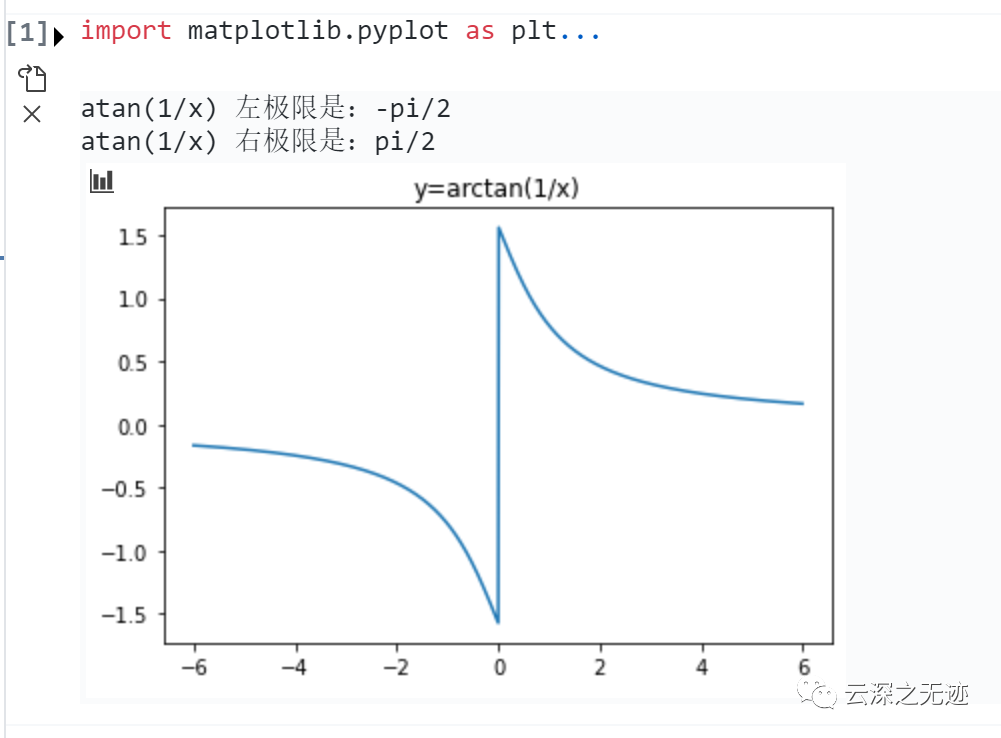
https://blog.csdn.net/weixin_43793874/article/details/94877114?utm_medium=distribute.pc_relevant.none-task-blog-2%7Edefault%7EBlogCommendFromMachineLearnPai2%7Edefault-2.vipsorttest&depth_1-utm_source=distribute.pc_relevant.none-task-blog-2%7Edefault%7EBlogCommendFromMachineLearnPai2%7Edefault-2.vipsorttestimport matplotlib.pyplot as plt import numpy as np import sympy as sp求函数 y=arctan(1/x) 的左右极限
x = sp.Symbol('x')
fr = sp.atan(1 / x)
xl = sp.limit(fr, x, 0, dir='-')
xr = sp.limit(fr, x, 0, dir='+')
print('%s 左极限是:%s' % (str(fr), str(xl)))
print('%s 右极限是:%s' % (str(fr), str(xr)))绘制函数 y=arctan(1/x) 的图像
x = np.arange(-6, 6, 0.01)
y = np.arctan(1 / x)
plt.title('y=arctan(1/x)')
plt.plot(x, y)
plt.show()
import matplotlib.pyplot as plt
import numpy as np
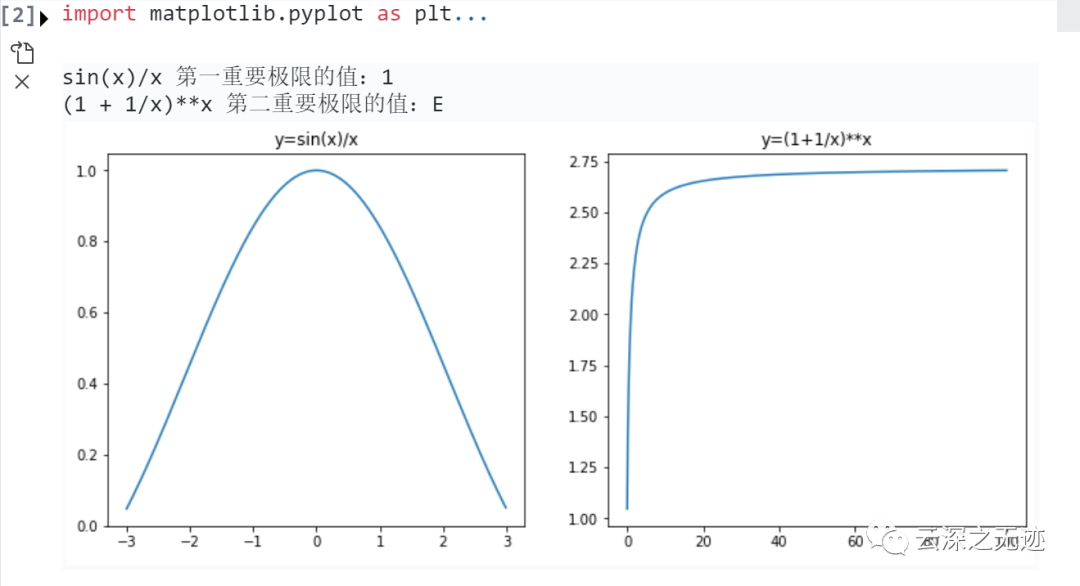
import sympy as sp分析两个重要极限
x = sp.Symbol('x')
f1 = sp.sin(x) / x
f2 = (1 + 1 / x) ** x
x1 = sp.limit(f1, x, 0)
x2 = sp.limit(f2, x, 'oo')
print('%s 第一重要极限的值:%s' % (str(f1), str(x1)))
print('%s 第二重要极限的值:%s' % (str(f2), str(x2)))绘制函数图像分析两个重要极限
x1 = np.arange(-3, 3, 0.01)
x2 = np.arange(0.01, 100, 0.1)
y1 = np.sin(x1) / x1
y2 = (1 + 1 / x2) ** x2
plt.figure(figsize=(12, 5))
plt.subplot(121)
plt.title('y=sin(x)/x')
plt.plot(x1, y1)
plt.subplot(122)
plt.title('y=(1+1/x)**x')
plt.plot(x2, y2)
plt.show()
import matplotlib.pyplot as plt
import numpy as np
import sympy as sp导数与微分
x = sp.Symbol('x')
f = 2 * x ** 3 + 3 * x ** 2 - 12 * x + 7
d = sp.diff(f)
print('%s 的导函数为:%s' % (f, d))
y_d = d.evalf(subs={x: -1})
y_h = f.evalf(subs={x: -1})
print('将x=-1代入导函数求解为:%d' % (y_d))
print('将x=-1代入原函数求解为:%d' % (y_h))
f_d = y_d * (x + 1) + y_h
print('得出切线方程为:%s' % f_d)绘制函数图和切线图
x = np.arange(-4, 3, 0.01)
y1 = 2 * x ** 3 + 3 * x ** 2 - 12 * x + 7
y2 = 8 - 12 * x
plt.title('函数y=2x**3+3x**2-12*x+7以及当x=-1时的切线')
plt.rcParams['font.sans-serif'] = ['SimHei']
plt.rcParams['axes.unicode_minus'] = False
plt.plot(x, y1, x, y2)
plt.show()

import matplotlib.pyplot as plt

import numpy as np

from mpl_toolkits.mplot3d import Axes3D
x = np.arange(-1, 1, 0.05)

y = np.arange(-1, 1, 0.05)

x, y = np.meshgrid(x, y)

z1 = np.sqrt(x ** 2 + y ** 2)

z2 = np.sqrt(2 - x ** 2 - y ** 2)

ax = Axes3D(plt.figure())

plt.rcParams['font.sans-serif'] = ['SimHei']

plt.rcParams['axes.unicode_minus'] = False

ax.set_title('三重积分曲面')

ax.plot_surface(x, y, z1)

ax.plot_surface(x, y, z2)

plt.show()
