NRI,net reclassification index,净重新分类指数,是用来比较模型准确度的,这个概念有点难理解,但是非常重要,在临床研究中非常常见,是评价模型的一大利器!
在R语言中有很多包可以计算NRI,但是能同时计算logistic回归和cox回归的只有nricens包,PredictABEL可以计算logistic模型的净重分类指数,survNRI可以计算cox模型的净重分类指数。
- logistic的NRI
- nricens包
- PredictABEL包
- 生存分析的NRI
- nricens包
- survNRI包
logistic的NRI
nricens包
#install.packages("nricens") # 安装R包
library(nricens)
## Loading required package: survival
使用survival包中的pbc数据集用于演示,这是一份关于原发性硬化性胆管炎的数据,其实是一份用于生存分析的数据,是有时间变量的,但是这里我们用于演示logistic回归,只要不使用time这一列就可以了。
library(survival)只使用部分数据
dat = pbc[1:312,]
dat = dat[ dattime > 2000 | (dattime < 2000 & dat$status == 2), ]
str(dat) # 数据长这样
## 'data.frame': 232 obs. of 20 variables:$ id : int 1 2 3 4 6 8 9 10 11 12 ...
$ time : int 400 4500 1012 1925 2503 2466 2400 51 3762 304 ...
$ status : int 2 0 2 2 2 2 2 2 2 2 ...
$ trt : int 1 1 1 1 2 2 1 2 2 2 ...
$ age : num 58.8 56.4 70.1 54.7 66.3 ...
$ sex : Factor w/ 2 levels "m","f": 2 2 1 2 2 2 2 2 2 2 ...
$ ascites : int 1 0 0 0 0 0 0 1 0 0 ...
$ hepato : int 1 1 0 1 1 0 0 0 1 0 ...
$ spiders : int 1 1 0 1 0 0 1 1 1 1 ...
$ edema : num 1 0 0.5 0.5 0 0 0 1 0 0 ...
$ bili : num 14.5 1.1 1.4 1.8 0.8 0.3 3.2 12.6 1.4 3.6 ...
$ chol : int 261 302 176 244 248 280 562 200 259 236 ...
$ albumin : num 2.6 4.14 3.48 2.54 3.98 4 3.08 2.74 4.16 3.52 ...
$ copper : int 156 54 210 64 50 52 79 140 46 94 ...
$ alk.phos: num 1718 7395 516 6122 944 ...
$ ast : num 137.9 113.5 96.1 60.6 93 ...
$ trig : int 172 88 55 92 63 189 88 143 79 95 ...
$ platelet: int 190 221 151 183 NA 373 251 302 258 71 ...
$ protime : num 12.2 10.6 12 10.3 11 11 11 11.5 12 13.6 ...
$ stage : int 4 3 4 4 3 3 2 4 4 4 ...
dim(dat) # 232 20
## [1] 232 20
然后就是准备计算NRI所需要的各个参数。
# 定义结局事件,0是存活,1是死亡
event = ifelse(dattime < 2000 & datstatus == 2, 1, 0)两个只由预测变量组成的矩阵
z.std = as.matrix(subset(dat, select = c(age, bili, albumin)))
z.new = as.matrix(subset(dat, select = c(age, bili, albumin, protime)))建立2个模型
mstd = glm(event ~ age + bili + albumin, family = binomial(), data = dat, x=TRUE)
mnew = glm(event ~ age + bili + albumin + protime, family = binomial(), data = dat, x=TRUE)取出模型预测概率
p.std = mstd$fitted.values
p.new = mnew$fitted.values
然后就是计算NRI,对于二分类变量,使用nribin()函数,这个函数提供了3种参数使用组合,任选一种都可以计算出来(结果一样),以下3组参数任选1组即可。mdl.std, mdl.new 或者 event, z.std, z.new 或者 event, p.std, p.new。
# 这3种方法算出来都是一样的结果两个模型
nribin(mdl.std = mstd, mdl.new = mnew,
cut = c(0.3,0.7),
niter = 500,
updown = 'category')结果变量 + 两个只有预测变量的矩阵
nribin(event = event, z.std = z.std, z.new = z.new,
cut = c(0.3,0.7),
niter = 500,
updown = 'category')结果变量 + 两个模型得到的预测概率
nribin(event = event, p.std = p.std, p.new = p.new,
cut = c(0.3,0.7),
niter = 500,
updown = 'category')
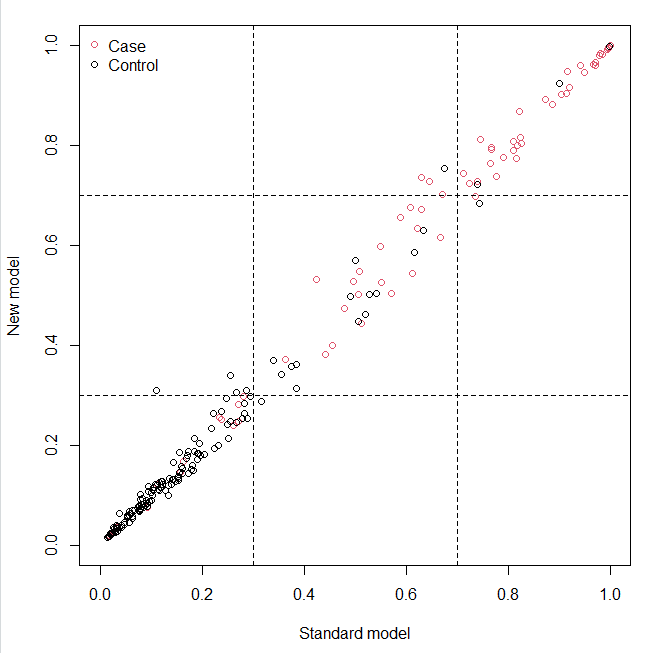
其中,cut是判断风险高低的阈值,我们使用了0.3,0.7,代表0-0.3是低风险,0.3-0.7是中风险,0.7-1是高风险,这个阈值是自己设置的,大家根据经验或者文献设置即可。
niter是使用bootstrap法进行重抽样的次数,默认是1000,大家可以自己设置。
updown参数,当设置为category时,表示低、中、高风险这种方式;当设置为diff时,此时cut的取值只能设置1个,比如设置0.2,即表示当新模型预测的风险和旧模型相差20%时,认为是重新分类。
上面的代码运行后结果是这样的:
UP and DOWN calculation:
#of total, case, and control subjects at t0: 232 88 144Reclassification Table for all subjects:
New
Standard < 0.3 < 0.7 >= 0.7
< 0.3 135 4 0
< 0.7 1 31 4
>= 0.7 0 2 55Reclassification Table for case:
New
Standard < 0.3 < 0.7 >= 0.7
< 0.3 14 0 0
< 0.7 0 18 3
>= 0.7 0 1 52Reclassification Table for control:
New
Standard < 0.3 < 0.7 >= 0.7
< 0.3 121 4 0
< 0.7 1 13 1
>= 0.7 0 1 3NRI estimation:
Point estimates:
Estimate
NRI 0.001893939
NRI+ 0.022727273
NRI- -0.020833333
Pr(Up|Case) 0.034090909
Pr(Down|Case) 0.011363636
Pr(Down|Ctrl) 0.013888889
Pr(Up|Ctrl) 0.034722222Now in bootstrap..
Point & Interval estimates:
Estimate Std.Error Lower Upper
NRI 0.001893939 0.027816095 -0.053995513 0.055354449
NRI+ 0.022727273 0.021564394 -0.019801980 0.065789474
NRI- -0.020833333 0.017312438 -0.058823529 0.007518797
Pr(Up|Case) 0.034090909 0.019007629 0.000000000 0.072164948
Pr(Down|Case) 0.011363636 0.010924271 0.000000000 0.039603960
Pr(Down|Ctrl) 0.013888889 0.009334685 0.000000000 0.035211268
Pr(Up|Ctrl) 0.034722222 0.014716046 0.006993007 0.066176471
首先是3个混淆矩阵,第一个是全体的,第2个是case(结局为1)组的,第3个是control(结局为2)组的,有了这3个矩阵,我们可以自己计算净重分类指数。
看case组:
净重分类指数 = ((0+3)-(0+1)) / 88 ≈ 0.022727273
再看control组:
净重分类指数 = ((1+1)-(4+1)) / 144 ≈ -0.020833333
相加净重分类指数 = case组净重分类指数 + control组净重分类指数 = 2/88 - 3/144 ≈ 0.000315657
再往下是不做bootstrap时得到的估计值,其中NRI就是绝对净重分类指数,NRI+是case组的净重分类指数,NRI-是control组的净重分类指数(和我们计算的一样哦),最后是做了500次bootstrap后得到的估计值,并且有标准误和可信区间。
最后还会得到一张图:

这张图中的虚线对应的坐标,就是我们在cut中设置的阈值,这张图对应的是上面结果中的第一个混淆矩阵,反应的是总体的情况,case是结果为1的组,也就是发生结局的组,control是结果为0的组,也就是未发生结局的组。
P值没有直接给出,但是可以自己计算。
# 计算P值

z <- abs(0.001893939/0.027816095)

p <- (1 - pnorm(z))*2

p
## [1] 0.9457157
PredictABEL包
#install.packages("PredictABEL") #安装R包
library(PredictABEL)取出模型预测概率,这个包只能用预测概率计算
p.std = mstd$fitted.values
p.new = mnew$fitted.values
然后就是计算NRI:
dat$event <- event
reclassification(data = dat,

cOutcome = 21, # 结果变量在哪一列

predrisk1 = p.std,

predrisk2 = p.new,

cutoff = c(0,0.3,0.7,1)

)
## _________________________________________Reclassification table
_________________________________________
Outcome: absent
Updated Model
Initial Model [0,0.3) [0.3,0.7) [0.7,1] % reclassified
[0,0.3) 121 4 0 3
[0.3,0.7) 1 13 1 13
[0.7,1] 0 1 3 25
Outcome: present
Updated Model
Initial Model [0,0.3) [0.3,0.7) [0.7,1] % reclassified
[0,0.3) 14 0 0 0
[0.3,0.7) 0 18 3 14
[0.7,1] 0 1 52 2
Combined Data
Updated Model
Initial Model [0,0.3) [0.3,0.7) [0.7,1] % reclassified
[0,0.3) 135 4 0 3
[0.3,0.7) 1 31 4 14
[0.7,1] 0 2 55 4
_________________________________________
NRI(Categorical) [95% CI]: 0.0019 [ -0.0551 - 0.0589 ] ; p-value: 0.94806
NRI(Continuous) [95% CI]: 0.0391 [ -0.2238 - 0.3021 ] ; p-value: 0.77048
IDI [95% CI]: 0.0044 [ -0.0037 - 0.0126 ] ; p-value: 0.28396
结果得到的是相加净重分类指数,还给出了IDI和P值。两个包算是各有优劣吧,大家可以自由选择。
生存分析的NRI
还是使用survival包中的pbc数据集用于演示,这次要构建cox回归模型,因此我们要使用time这一列了。
nricens包
library(nricens)
library(survival)
dat <- pbc[1:312,]
datstatus <- ifelse(datstatus==2, 1, 0) # 0表示活着,1表示死亡
然后准备所需参数:
# 两个只由预测变量组成的矩阵
z.std = as.matrix(subset(dat, select = c(age, bili, albumin)))
z.new = as.matrix(subset(dat, select = c(age, bili, albumin, protime)))建立2个cox模型
mstd <- coxph(Surv(time,status) ~ age + bili + albumin, data = dat, x=TRUE)
mnew <- coxph(Surv(time,status) ~ age + bili + albumin + protime, data = dat, x=TRUE)计算在2000天的模型预测概率,这一步不要也行,看你使用哪些参数
p.std <- get.risk.coxph(mstd, t0=2000)
p.new <- get.risk.coxph(mnew, t0=2000)
计算NRI:
nricens(mdl.std= mstd, mdl.new = mnew,
t0 = 2000,
cut = c(0.3, 0.7),
niter = 1000,
updown = 'category')UP and DOWN calculation:
#of total, case, and control subjects at t0: 312 88 144Reclassification Table for all subjects:
New
Standard < 0.3 < 0.7 >= 0.7
< 0.3 202 7 0
< 0.7 13 53 6
>= 0.7 0 0 31Reclassification Table for case:
New
Standard < 0.3 < 0.7 >= 0.7
< 0.3 19 3 0
< 0.7 3 32 4
>= 0.7 0 0 27Reclassification Table for control:
New
Standard < 0.3 < 0.7 >= 0.7
< 0.3 126 3 0
< 0.7 5 7 2
>= 0.7 0 0 1NRI estimation by KM estimator:
Point estimates:
Estimate
NRI 0.05377635
NRI+ 0.03748660
NRI- 0.01628974
Pr(Up|Case) 0.07708938
Pr(Down|Case) 0.03960278
Pr(Down|Ctrl) 0.04256352
Pr(Up|Ctrl) 0.02627378Now in bootstrap..
Point & Interval estimates:
Estimate Lower Upper
NRI 0.05377635 -0.082230381 0.16058172
NRI+ 0.03748660 -0.084245197 0.13231776
NRI- 0.01628974 -0.030861213 0.06753616
Pr(Up|Case) 0.07708938 0.000000000 0.19102291
Pr(Down|Case) 0.03960278 0.000000000 0.15236016
Pr(Down|Ctrl) 0.04256352 0.004671535 0.09863170
Pr(Up|Ctrl) 0.02627378 0.006400463 0.05998424

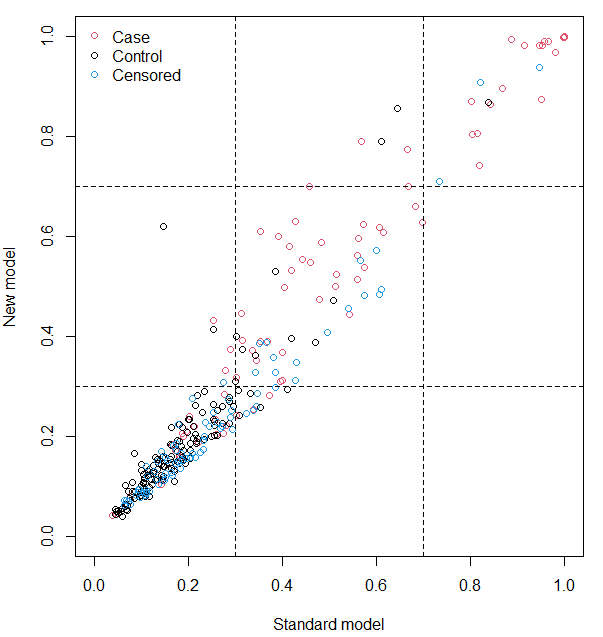
Snipaste_2022-05-20_21-49-38
结果的解读和logistic的一模一样。
survNRI包
# 安装R包

devtools::install_github("mdbrown/survNRI")
加载R包并使用,还是用上面的pbc数据集。
library(survNRI)
## Loading required package: MASS
library(survival)使用部分数据
dat <- pbc[1:312,]
datstatus <- ifelse(datstatus==2, 1, 0) # 0表示活着,1表示死亡
res <- survNRI(time = "time", event = "status",
model1 = c("age", "bili", "albumin"), # 模型1的自变量
model2 = c("age", "bili", "albumin", "protime"), # 模型2的自变量
data = dat,
predict.time = 2000, # 预测的时间点
method = "all",
bootMethod = "normal",
bootstraps = 500,
alpha = .05)
查看结果,estimates给出了不同组的NRI以及总的NRI,包括了使用不同方法(KM/IPW/SmoothIPW/SEM/Combined)得到的结果;CI给出了可信区间。
res
## $estimatesNRI.event NRI.nonevent NRI
KM 0.20445422 0.3187408 0.5231951
IPW 0.22424434 0.3273544 0.5515987
SmoothIPW 0.19645006 0.3144263 0.5108763
SEM 0.07478611 0.2632127 0.3379988
Combined 0.19633867 0.3143794 0.5107181
$CI
CINRI.event
KM IPW SmoothIPW SEM Combined
lowerbound -0.03915924 -0.02185068 -0.04724202 -0.1162587 -0.0473723
upperbound 0.44806768 0.47033936 0.44014214 0.2658309 0.4400496
CINRI.nonevent
KM IPW SmoothIPW SEM Combined
lowerbound 0.1317108 0.1396315 0.1286685 0.08638933 0.1286426
upperbound 0.7102251 0.7393216 0.6966341 0.51482212 0.6964549
CINRI
KM IPW SmoothIPW SEM Combined
lowerbound -0.05112533 -0.04569046 -0.05439863 -0.04132364 -0.05443409
upperbound 0.89306122 0.92464359 0.87970125 0.64253510 0.87953153
$bootMethod
[1] "normal"
$predict.time
[1] 2000
$alpha
[1] 0.05
attr(,"class")
[1] "survNRI"
OK,这就是NRI的计算,除此之外,随机森林、决策树、lasso回归、SVM等,这些模型,都是可以计算的NRI的,后面会继续介绍。大家如果有问题欢迎在评论区留言。
以上就是今天的内容,希望对你有帮助哦!