大神一句话,菜鸟跑半年。我不是大神,但我可以缩短你走弯路的半年~
就像歌儿唱的那样,如果你不知道该往哪儿走,就留在这学点生信好不好~
这里有豆豆和花花的学习历程,从新手到进阶,生信路上有你有我!
0.Time C-index
C-index 是一致性指数,与AUC值一样是评价模型预测能力的指标,在预后模型里,time-ROC很常见,Time C-index却不咋常见,今天整理一下它的代码。
1.单个模型的Time C-index
rm(list = ls()) library(rms) library(pec) library(ggplot2) #编造示例数据 n = 200 set.seed(123) dat = data.frame(time = runif(n,0,11), status = rbinom(n, size = 1, prob = 0.5), x1 = rnorm(n), x2 = rbinom(n, size = 1, prob = 0.5)) head(dat)time status x1 x2
1 3.1633527 0 2.1988103 0
2 8.6713565 1 1.3124130 0
3 4.4987461 1 -0.2651451 0
4 9.7131914 1 0.5431941 0
5 10.3451401 0 -0.4143399 0
6 0.5011215 1 -0.4762469 1
构建cox模型,单因素的和多因素的都可以
model = cph(Surv(time,status)~x1+x2,data=dat,x=TRUE,y=TRUE,surv = T)
modelCox Proportional Hazards Model
cph(formula = Surv(time, status) ~ x1 + x2, data = dat, x = TRUE,
y = TRUE, surv = T)
Model Tests Discrimination
Indexes
Obs 200 LR chi2 0.71 R2 0.004
Events 92 d.f. 2 R2(2,200)0.000
Center 0.0628 Pr(> chi2) 0.7005 R2(2,92) 0.000
Score chi2 0.71 Dxy 0.075
Pr(> chi2) 0.7013
Coef S.E. Wald Z Pr(>|Z|)
x1 -0.0634 0.1114 -0.57 0.5690
x2 0.1260 0.2134 0.59 0.5549
time-cindex 计算
times <- c(1, 3, 5, 7, 10)
cindex<- cindex(model,
formula=Surv(time,status)~1,
eval.times = times,
data=dat)
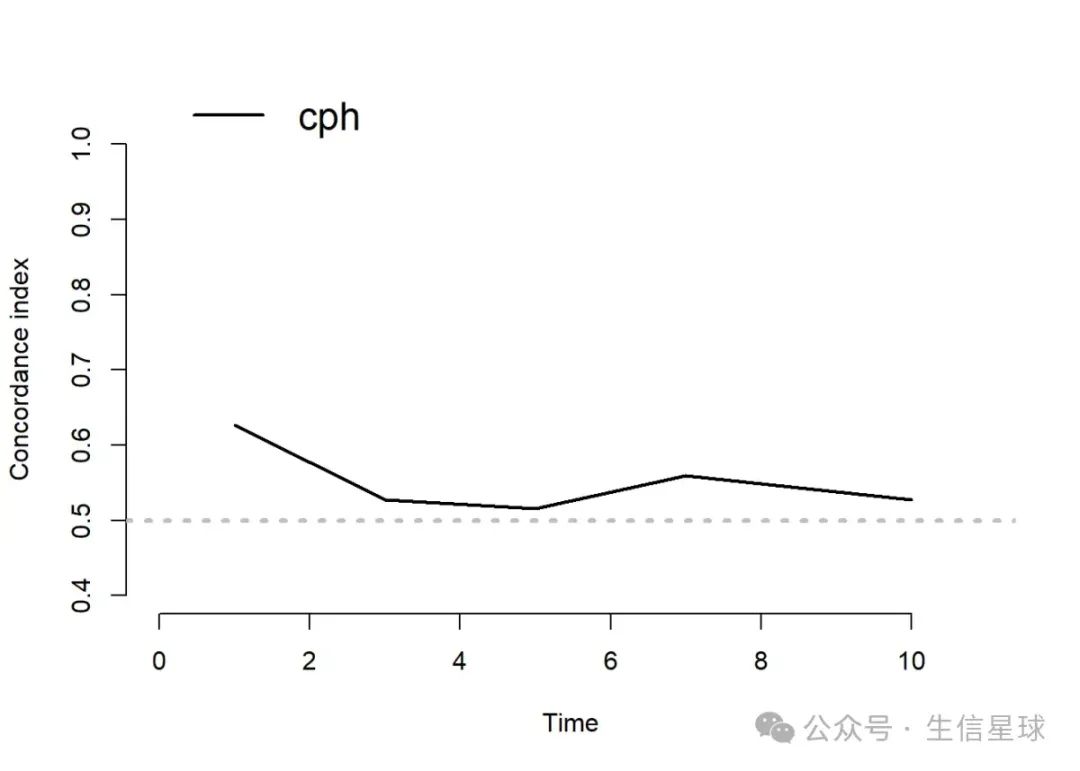
plot(cindex)

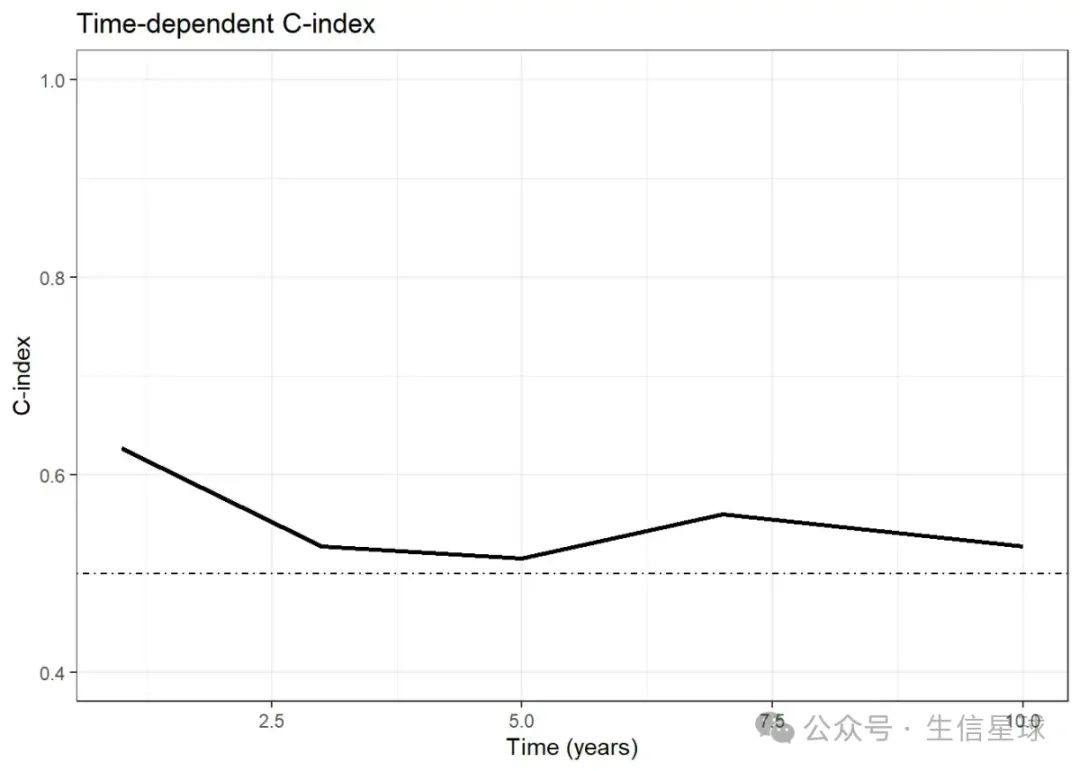
plot画的图太吃藕啦,我们用ggplot2画
cindex_df <- data.frame(
Time = times,
cindex = cindexAppCindexcph
)
head(cindex_df)Time cindex
1 1 0.6263943
2 3 0.5270632
3 5 0.5154819
4 7 0.5597028
5 10 0.5268912
ggplot(cindex_df, aes(x = Time, y = cindex)) +
geom_line(linewidth = 1) +
geom_hline(yintercept = 0.5,linetype = 4)+
ylim(0.4,1)+
labs(title = "Time-dependent C-index", x = "Time (years)", y = "C-index") +
theme_bw()

2.多个模型的Time C-index 比较
rm(list = ls())
library(rms)
library(pec)
library(ggplot2)
#编造示例数据
n = 200
set.seed(123)
dat = data.frame(time = runif(n,0,11),
status = rbinom(n, size = 1, prob = 0.5),
x1 = rnorm(n),
x2 = rbinom(n, size = 1, prob = 0.5))
head(dat)time status x1 x2
1 3.1633527 0 2.1988103 0
2 8.6713565 1 1.3124130 0
3 4.4987461 1 -0.2651451 0
4 9.7131914 1 0.5431941 0
5 10.3451401 0 -0.4143399 0
6 0.5011215 1 -0.4762469 1
构建模型并存到一个列表里
models = list(X1_2=cph(Surv(time,status)~x1+x2,data=dat,x=TRUE,y=TRUE,surv = T),
X1=cph(Surv(time,status)~x1,data=dat,x=TRUE,y=TRUE,surv = T),
X2=cph(Surv(time,status)~x2,data=dat,x=TRUE,y=TRUE,surv = T))time-cindex 计算
times <- c(1, 3, 5, 7, 10)
cindex<- cindex(models,
formula=Surv(time,status)~1,
eval.times = times,
data=dat)
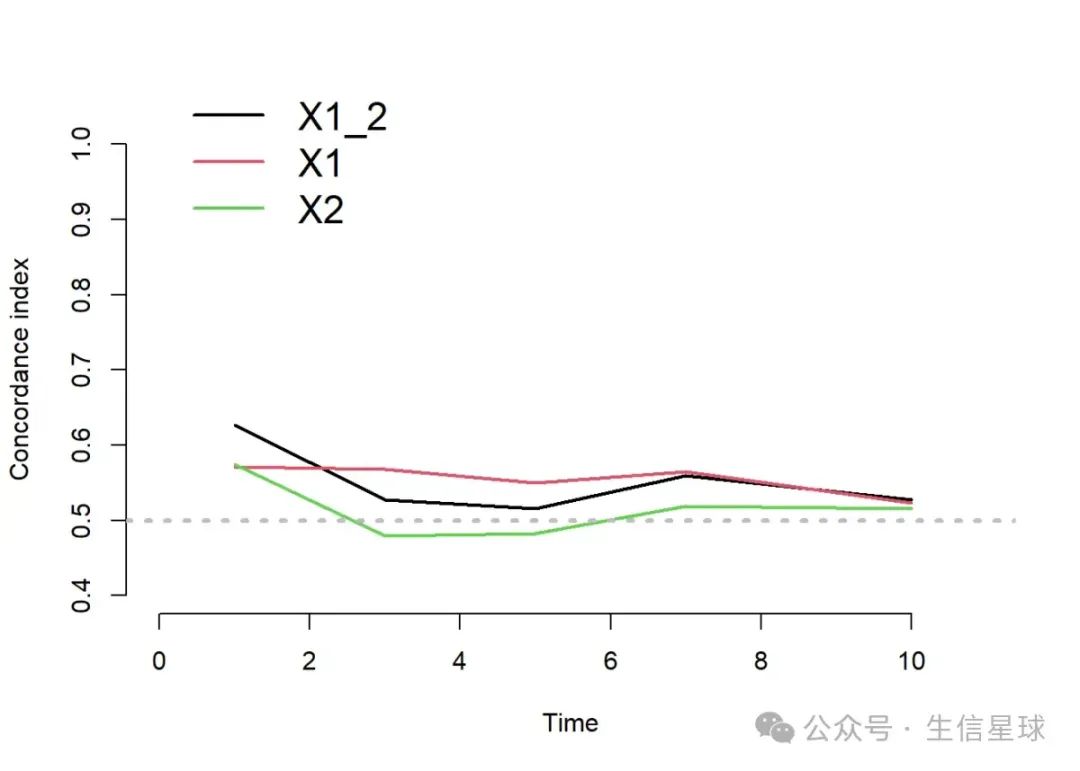
plot(cindex)

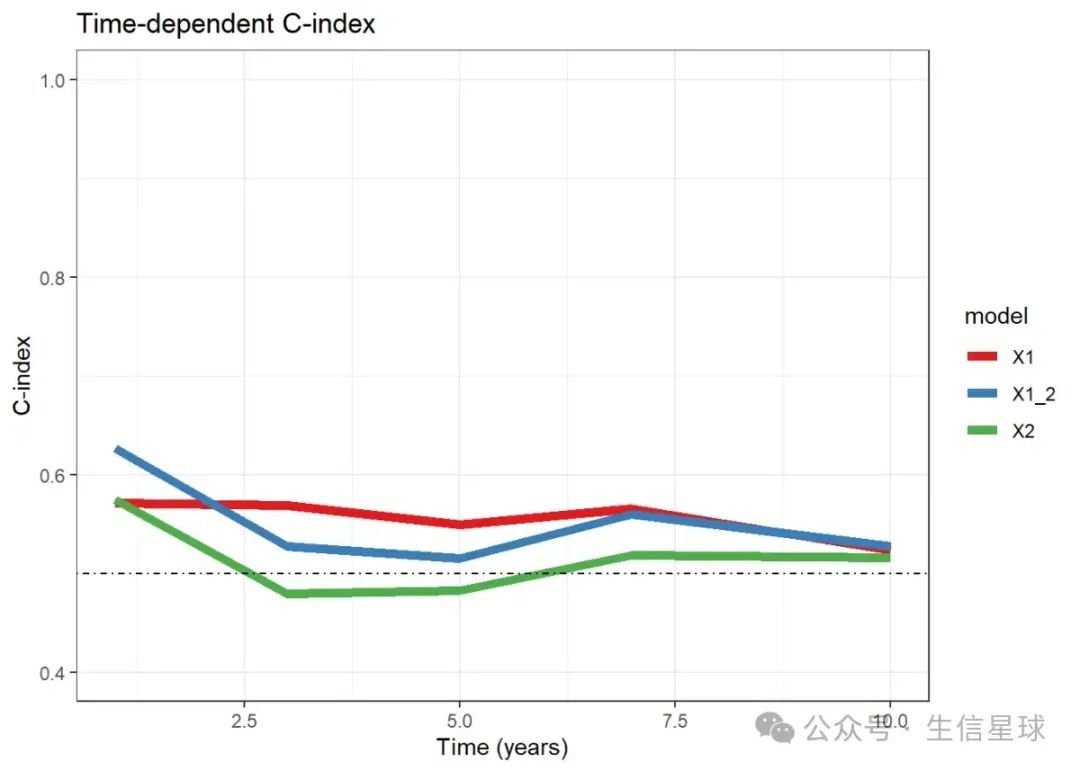
同样是用ggplot2画,但这次是多个模型,cindexAppCindex里面是3个向量</p><div class="rno-markdown-code"><div class="rno-markdown-code-toolbar"><div class="rno-markdown-code-toolbar-info"><div class="rno-markdown-code-toolbar-item is-type"><span class="is-m-hidden">代码语言:</span>javascript</div></div><div class="rno-markdown-code-toolbar-opt"><div class="rno-markdown-code-toolbar-copy"><i class="icon-copy"></i><span class="is-m-hidden">复制</span></div></div></div><div class="developer-code-block"><pre class="prism-token token line-numbers language-javascript"><code class="language-javascript" style="margin-left:0">cindexAppCindex
$X1_2
[1] 0.6263943 0.5270632 0.5154819 0.5597028 0.5268912
$X1
[1] 0.5713741 0.5684069 0.5495599 0.5651314 0.5231363
$X2
[1] 0.5745114 0.4791345 0.4821615 0.5186476 0.5155350
所以需要宽变长才能给ggplot2用
cindex_df <- data.frame(
Time = times,
do.call(cbind,cindex$AppCindex)
)
cindex_dfTime X1_2 X1 X2
1 1 0.6263943 0.5713741 0.5745114
2 3 0.5270632 0.5684069 0.4791345
3 5 0.5154819 0.5495599 0.4821615
4 7 0.5597028 0.5651314 0.5186476
5 10 0.5268912 0.5231363 0.5155350
#宽变长
library(tidyr)
dat = pivot_longer(cindex_df,cols = 2:4,
names_to = "model",
values_to = "cindex")
head(dat)# A tibble: 6 × 3
Time model cindex
<dbl> <chr> <dbl>
1 1 X1_2 0.626
2 1 X1 0.571
3 1 X2 0.575
4 3 X1_2 0.527
5 3 X1 0.568
6 3 X2 0.479
library(ggplot2)
ggplot(dat, aes(x = Time, y = cindex)) +
geom_line(aes(color = model),linewidth = 2) +
scale_color_brewer(palette = "Set1")+
geom_hline(yintercept = 0.5,linetype = 4)+
ylim(0.4,1)+
labs(title = "Time-dependent C-index", x = "Time (years)", y = "C-index") +
theme_bw()
