一. 安装
pip install mayavi -i https://pypi.tuna.tsinghua.edu.cn/simple # 报错 推荐下面的这条指令安装
pip install git+https://github.com/enthought/mayavi.git
二. 使用
1. Mayavi库基本元素
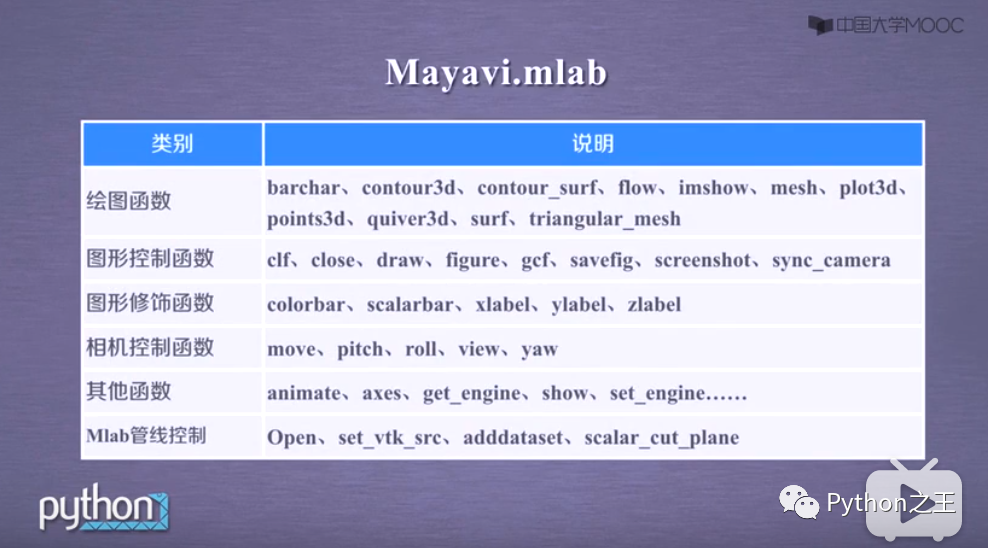
1. 处理/显示图形的mlab模块
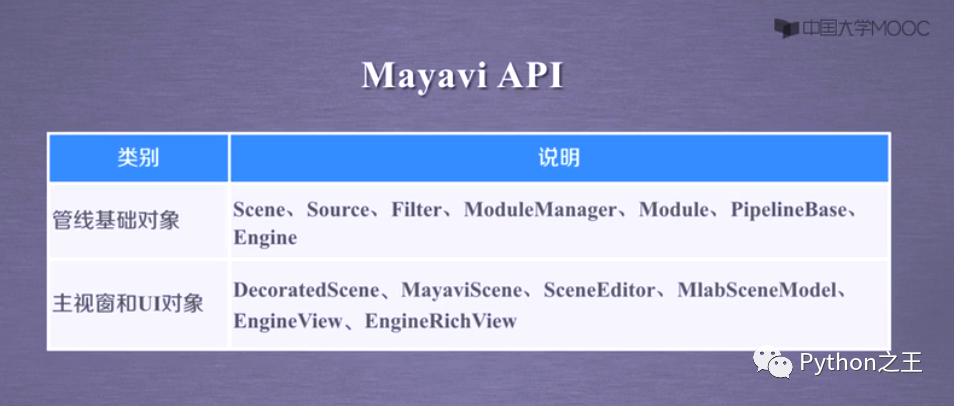
2. Mayavi的api
2. 快速绘图实例
实例代码1:
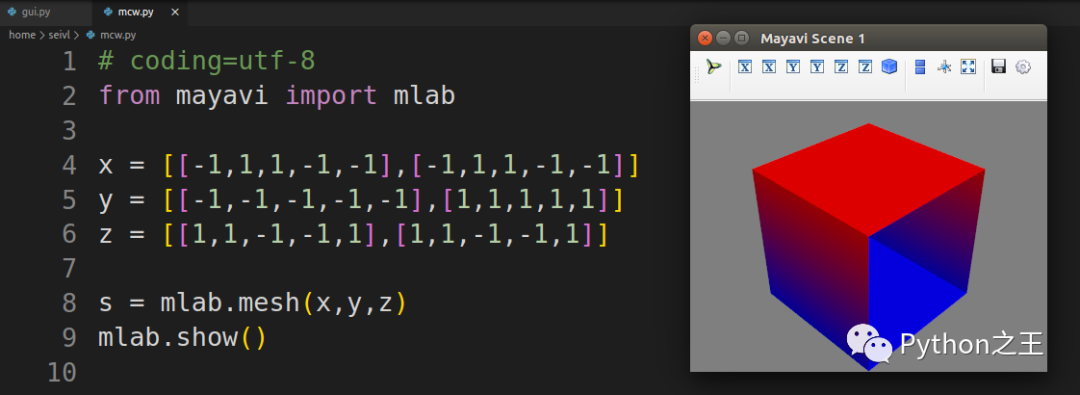
# coding=utf-8
from mayavi import mlabx = [[-1,1,1,-1,-1],[-1,1,1,-1,-1]]
y = [[-1,-1,-1,-1,-1],[1,1,1,1,1]]
z = [[1,1,-1,-1,1],[1,1,-1,-1,1]]s = mlab.mesh(x,y,z)
mlab.show()
效果:
只显示框的话:
from mayavi import mlabx = [[-1,1,1,-1,-1],[-1,1,1,-1,-1]]
y = [[-1,-1,-1,-1,-1],[1,1,1,1,1]]
z = [[1,1,-1,-1,1],[1,1,-1,-1,1]]s = mlab.mesh(x, y, z,representation = 'wireframe', line_width = 1.0)
mlab.show()
效果:

实例代码2:
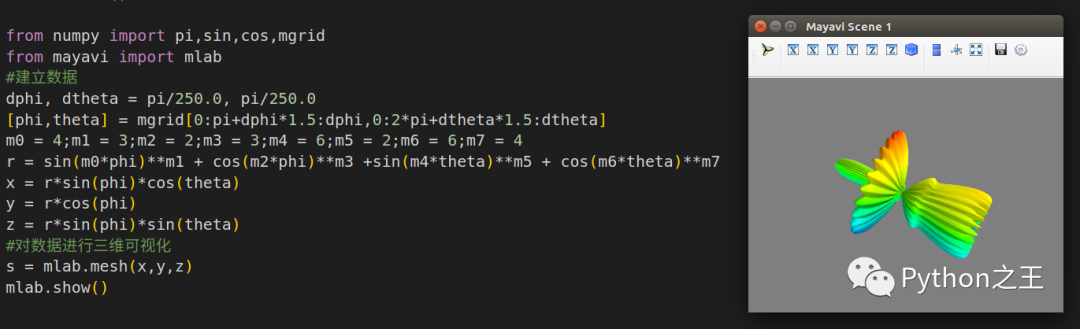
from numpy import pi,sin,cos,mgrid

from mayavi import mlab

#建立数据

dphi, dtheta = pi/250.0, pi/250.0

[phi,theta] = mgrid[0:pi+dphi1.5:dphi,0:2pi+dtheta1.5:dtheta]

m0 = 4;m1 = 3;m2 = 2;m3 = 3;m4 = 6;m5 = 2;m6 = 6;m7 = 4

r = sin(m0phi)**m1 + cos(m2phi)**m3 +sin(m4theta)**m5 + cos(m6theta)**m7

x = rsin(phi)cos(theta)

y = rcos(phi)

z = r*sin(phi)*sin(theta)

#对数据进行三维可视化

s = mlab.mesh(x,y,z)

mlab.show()
效果:
3 基于numpy数组绘图
基本知识:


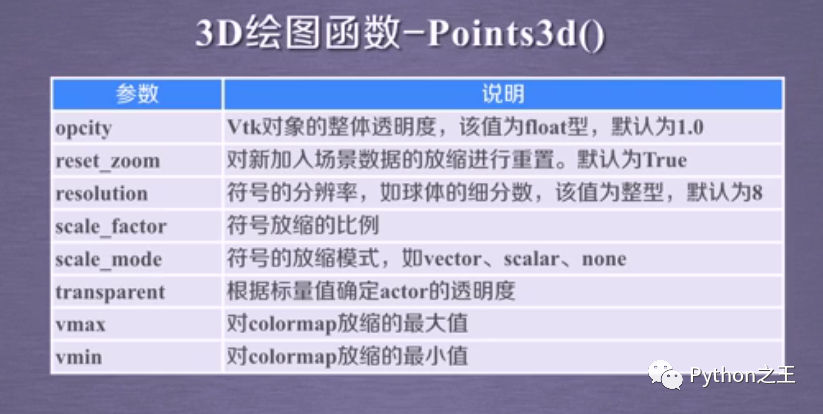
1. Points3d
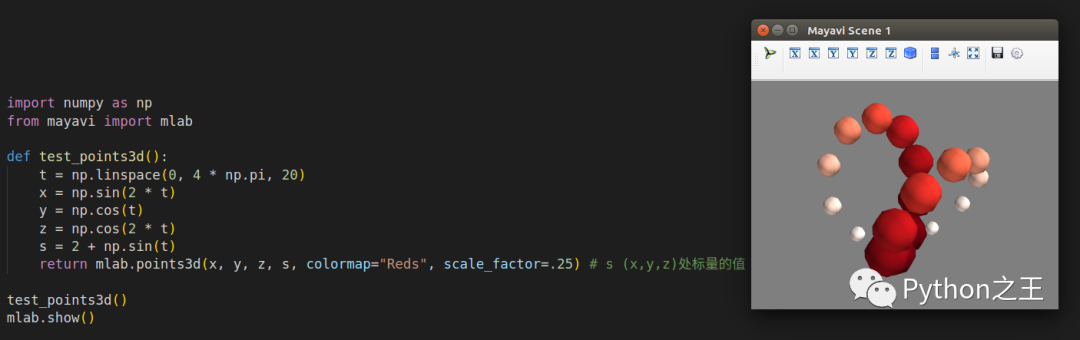
实现代码:
import numpy as np
from mayavi import mlabdef test_points3d():
t = np.linspace(0, 4 * np.pi, 20)
x = np.sin(2 * t)
y = np.cos(t)
z = np.cos(2 * t)
s = 2 + np.sin(t)
return mlab.points3d(x, y, z, s, colormap="Reds", scale_factor=.25) # s (x,y,z)处标量的值 coppertest_points3d()
mlab.show()
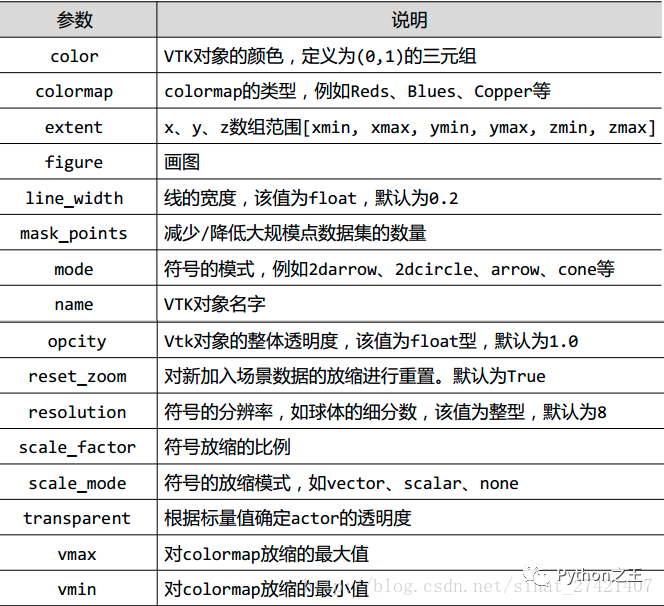
参数说明:
结果:
2. Plot3d
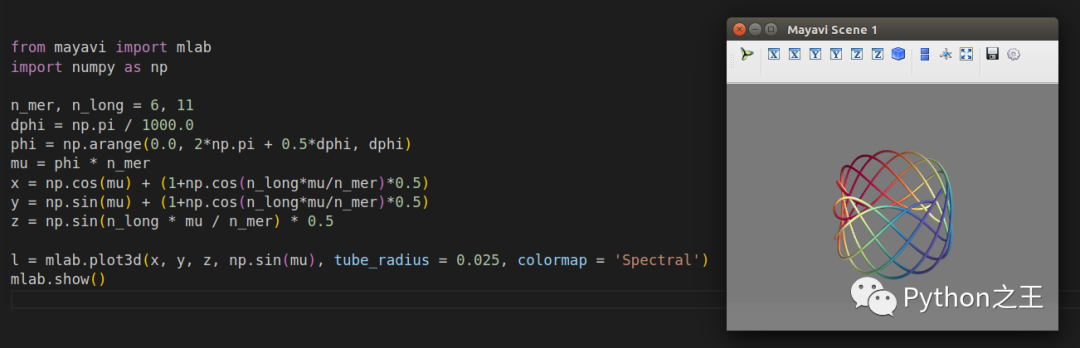
实现代码:
from mayavi import mlab
import numpy as npn_mer, n_long = 6, 11
dphi = np.pi / 1000.0
phi = np.arange(0.0, 2np.pi + 0.5dphi, dphi)
mu = phi * n_mer
x = np.cos(mu) + (1+np.cos(n_long*mu/n_mer)0.5)
y = np.sin(mu) + (1+np.cos(n_longmu/n_mer)*0.5)
z = np.sin(n_long * mu / n_mer) * 0.5l = mlab.plot3d(x, y, z, np.sin(mu), tube_radius = 0.025, colormap = 'Spectral')
mlab.show()
效果:
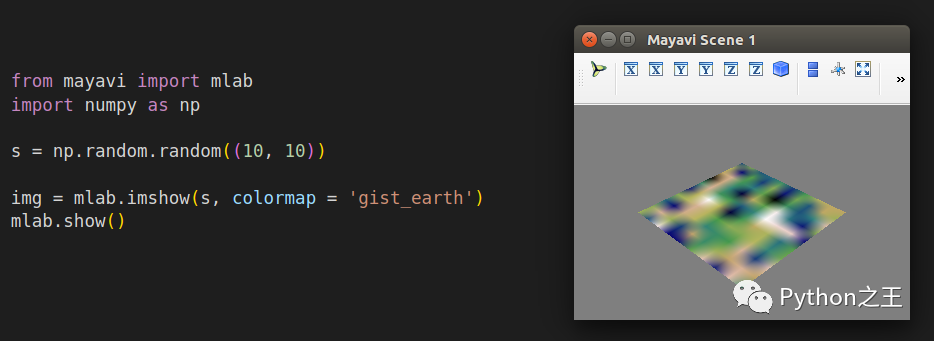
3. imshow
实现代码:
from mayavi import mlab
import numpy as nps = np.random.random((10, 10))
img = mlab.imshow(s, colormap = 'gist_earth')
mlab.show()
效果:
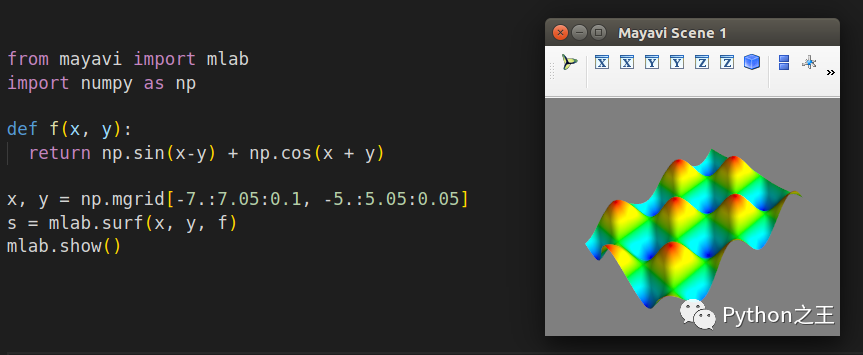
4. surf
实现代码1:
from mayavi import mlab
import numpy as npdef f(x, y):
return np.sin(x-y) + np.cos(x + y)x, y = np.mgrid[-7.:7.05:0.1, -5.:5.05:0.05]
s = mlab.surf(x, y, f)
mlab.show()
效果:
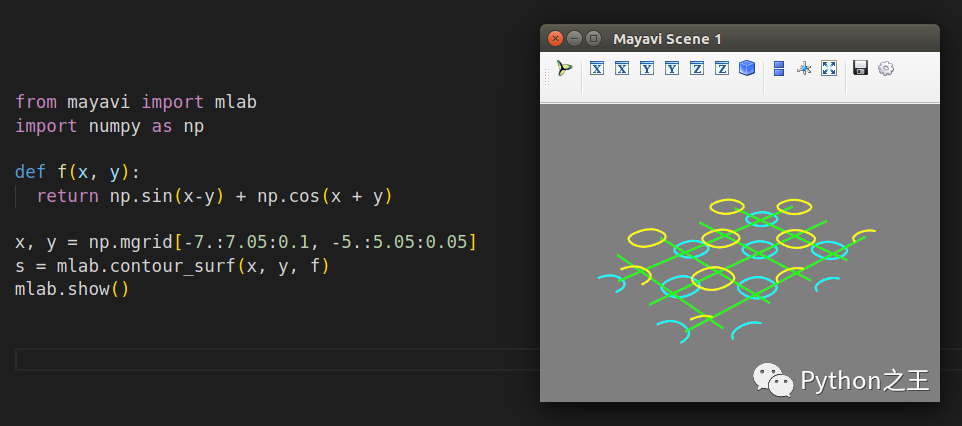
实现代码2:
from mayavi import mlab
import numpy as npdef f(x, y):
return np.sin(x-y) + np.cos(x + y)x, y = np.mgrid[-7.:7.05:0.1, -5.:5.05:0.05]
s = mlab.contour_surf(x, y, f)
mlab.show()
效果:
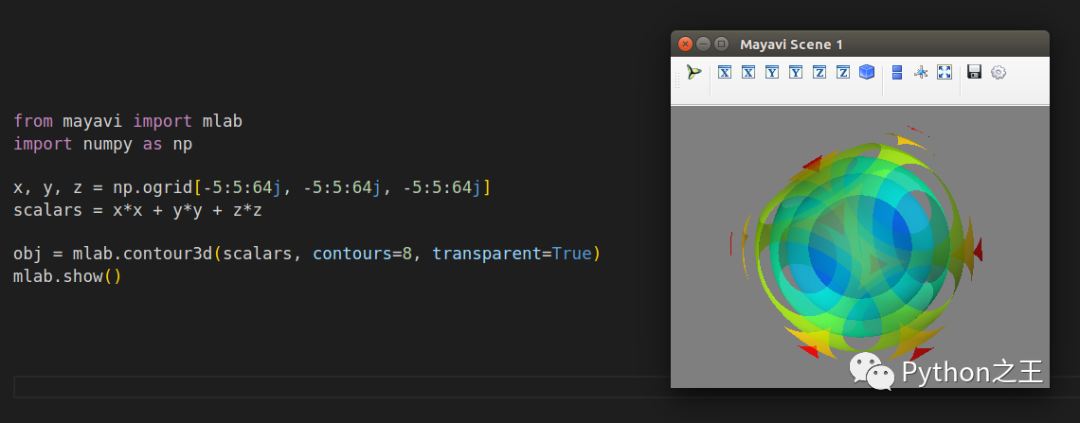
5. contour3d
实现代码:
from mayavi import mlab
import numpy as npx, y, z = np.ogrid[-5:5:64j, -5:5:64j, -5:5:64j]
scalars = xx + yy + z*zobj = mlab.contour3d(scalars, contours=8, transparent=True)
mlab.show()
效果:
6. quiver3d
实现代码:
import numpy as np
from mayavi import mlabx, y, z = np.mgrid[-2:3, -2:3, -2:3]
r = np.sqrt(x ** 2 + y ** 2 + z ** 4)
u = y * np.sin(r)/(r + 0.001)
v = -x * np.sin(r)/(r+0.001)
w = np.zeros_like(z)obj = mlab.quiver3d(x, y, z, u, v, w, line_width=3, scale_factor=1)
mlab.show()
效果:
