最近学习吴恩达《Machine Learning》课程以及《深度学习入门:基于Python的理论与实现》书,一些东西总结了下。现就后者学习进行笔记总结。本文是本书的学习笔记(一)Python入门。
NumPy
import sys, os
sys.path.append('../input/deeplearningfromscratch/deeplearningfromscratch')  # 为了导入父目录中的文件而进行的设定
import numpy as np

x= np.array([1.0, 2.0, 3.0])

print(x)
[1. 2. 3.]
type(x)numpy.ndarray
# 下面是NumPy数组的算术运算例子

x = np.array([1.0, 2.0, 3.0])

y = np.array([2.0, 3.0, 4.0])

print(x + y)

print(x - y)

print(x * y) # element-wise porduct

print(x / y)
[3. 5. 7.]
[-1. -1. -1.]
[ 2. 6. 12.]
[0.5 0.66666667 0.75 ]
当x和y的元素个数相同时,可以对各个元素进行算术运算。如果元素个数不同,程序就会报错。所以元素个数保持一致非常重要。
另外,对应元素的英文是element-wise,比如“对应元素的乘法”就是element-wisse product
NumPy数组也可以和单一的数值(标量)组合起来进行运算。此时,需要在NumPy数组的各个元素和标量之间进行运算。这个功能也被称为广播。
x = np.array([1.0, 2.0, 3.0])

print(x / 2.0)
[0.5 1. 1.5]
# NumPy的多维数组

A = np.array([[1, 2],[3, 4]])

print(A)
[[1 2]
[3 4]]
矩阵的形状可以通过shape查看,矩阵元素的数据类型可以通过dtype查看
A.shape(2, 2)
A.dtypedtype('int64')
# 矩阵的算术运算

B = np.array([[3, 0],[0,6]])

A+B
array([[ 4, 2],
[ 3, 10]])
ABarray([[ 3, 0],
[ 0, 24]])
同样,矩阵也可以通过标量(单一数值)对矩阵进行算术运算,这也是基于广播的功能
print(A)

A10
[[1 2]
[3 4]]array([[10, 20],
[30, 40]])
在上面这个例子中,标量10被扩展成了2x2的形状,然后再与矩阵A进行乘法运算。这个巧妙的功能称为广播。
# 一个广播的例子

A = np.array([[1, 2], [3, 4]])

B = np.array([10, 20])

A * B
array([[10, 40],
[30, 80]])
上面这个运算中,一维数组B被巧妙地变成了和二维数组A相同的形状,然后再以对应元素的方式进行计算。
综上,因为NumPy有广播功能,所以不同形状的数组之间也可以顺利地进行运算。
# 访问元素

X = np.array([[51, 55],[14,19],[0,4]])

print(X)
[[51 55]
[14 19]
[ 0 4]]
for row in X:

print(row)
[51 55]
[14 19]
[0 4]
# 使用数组访问各个元素

X = X.flatten() # 将X转换为一维数组

print(X)
[51 55 14 19 0 4]
X[np.array([0,2,4])] #获取索引为0、2、4的元素array([51, 14, 0])
# 从X中抽取大于15的元素

X > 15
array([ True, True, False, True, False, False])
X[X>15]array([51, 55, 19])
对NumPy数组使用不等号运算符等(上例中是X>15),结果会得到一个布尔型的数组。上例中就是使用这个布尔型数组取出了数组的各个元素(取出True对应的元素)。
Matplotlib
import numpy as np

import matplotlib.pyplot as plt#生成数据
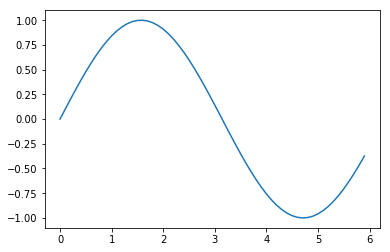
x = np.arange(0, 6, 0.1) #生成0-6的数据,步长为0.1
y = np.sin(x)
#绘制图像
plt.plot(x,y)
plt.show()
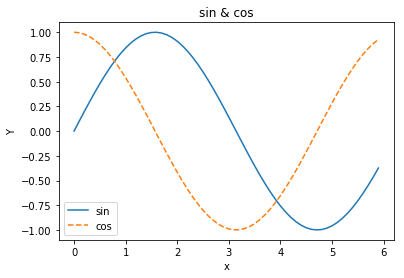
# 尝试追加cos函数的图形,并尝试使用pyplot的添加标题和x轴标签名等其他功能

y2 = np.cos(x)
plt.plot(x, y, label="sin")

plt.plot(x, y2, linestyle = "--", label="cos")#用虚线绘制

plt.xlabel("x")

plt.ylabel("Y")

plt.title('sin & cos')

plt.legend()

plt.show()

pyplot中还提供了用于显示图像的方法imshow()。另外,可以使用matplotlib.image模块的imread()方法读入图像。
from matplotlib.image import imread

img = imread('../input/lixiangzhilu/1.jpg')

plt.imshow(img)
<matplotlib.image.AxesImage at 0x7f08bf324cf8>
