Prometheus Server 使用
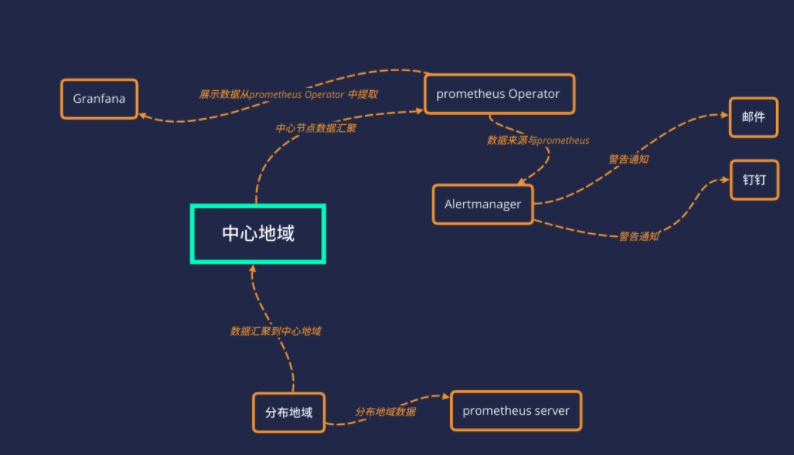
目前环境中使用的架构
安装prometheus
其中 prometheus.yml 文件的基本配置如下:
global:
  scrape_interval:     15s
  evaluation_interval: 15s
rule_files:
- "first.rules"
- "second.rules"
scrape_configs:
job_name: prometheus

static_configs:
targets: ['localhost:9090']
上面这个配置文件中包含了3个模块:global、rule_files 和 scrape_configs。
其中 global 模块控制 Prometheus Server 的全局配置:
scrape_interval:表示 prometheus 抓取指标数据的频率,默认是15s,我们可以覆盖这个值 evaluation_interval:用来控制评估规则的频率,prometheus 使用规则产生新的时间序列数据或者产生警报 rule_files 模块制定了规则所在的位置,prometheus 可以根据这个配置加载规则,用于生成新的时间序列数据或者报警信息,当前我们没有配置任何规则。
scrape_configs 用于控制 prometheus 监控哪些资源。由于 prometheus 通过 HTTP 的方式来暴露的它本身的监控数据,prometheus 也能够监控本身的健康情况。在默认的配置里有一个单独的 job,叫做prometheus,它采集 prometheus 服务本身的时间序列数据。这个 job 包含了一个单独的、静态配置的目标:监听 localhost 上的9090端口。prometheus 默认会通过目标的/metrics路径采集 metrics。所以,默认的 job 通过 URL:http://localhost:9090/metrics采集 metrics。收集到的时间序列包含 prometheus 服务本身的状态和性能。如果我们还有其他的资源需要监控的话,直接配置在该模块下面就可以了。
新创建一个监控的命名空间, monitoring
cat > monitoring_ns.yaml <<EOF

apiVersion: v1

kind: Namespace

metadata:

name: monitoring

EOF
将 prometheus-cm.yaml 文件用 ConfigMap 的形式进行管理:
cat > prometheus-cm.yaml <<EOF

apiVersion: v1

kind: ConfigMap

metadata:

name: prometheus-config

namespace: monitoring

data:

prometheus.yml: |

global:

scrape_interval: 15s

scrape_timeout: 15s

scrape_configs:
job_name: 'prometheus'

static_configs:
targets: ['localhost:9090']

EOF
创建资源对象:
kubectl create -f prometheus-cm.yaml
配置文件创建完成了,以后如果我们有新的资源需要被监控,我们只需要将上面的 ConfigMap 对象更新即可。现在我们来创建 prometheus 的 Pod 资源:(prometheus-deploy.yaml),由于没有创建pv,暂时先不持久化。
cat > prometheus-deploy.yaml <<EOF
apiVersion: extensions/v1beta1
kind: Deployment
metadata:
name: prometheus
namespace: monitoring
labels:
app: prometheus
spec:
template:
metadata:
labels:
app: prometheus
spec:
serviceAccountName: prometheus
containers:
image: prom/prometheus:v2.14.0
name: prometheus
command:
- "/bin/prometheus"
args:
- "--config.file=/etc/prometheus/prometheus.yml"
- "--storage.tsdb.path=/prometheus"
- "--storage.tsdb.retention=24h"
- "--web.enable-admin-api" # 控制对admin HTTP API的访问,其中包括删除时间序列等功能
- "--web.enable-lifecycle" # 支持热更新,直接执行localhost:9090/-/reload立即生效
ports:
- containerPort: 9090
protocol: TCP
name: http
volumeMounts:
- mountPath: "/prometheus"
subPath: prometheus
name: data
- mountPath: "/etc/prometheus"
name: config-volume
resources:
requests:
cpu: 100m
memory: 512Mi
limits:
cpu: 100m
memory: 512Mi
securityContext:
runAsUser: 0
volumes:
name: data
persistentVolumeClaim:
claimName: prometheus
emptyDir: {}
configMap:

name: prometheus-config

name: config-volume

EOF
在启动程序的时候,除了指定了 prometheus.yml 文件之外,还通过参数storage.tsdb.path指定了 TSDB 数据的存储路径、通过storage.tsdb.retention设置了保留多长时间的数据,还有下面的web.enable-admin-api参数可以用来开启对 admin api 的访问权限,参数web.enable-lifecycle非常重要,用来开启支持热更新的,有了这个参数之后,prometheus.yml 配置文件只要更新了,通过执行localhost:9090/-/reload就会立即生效,所以一定要加上这个参数。
除了上面的注意事项外,这里还需要配置 rbac 认证,因为需要在 prometheus 中去访问 Kubernetes 的相关信息,所以这里管理了一个名为 prometheus 的 serviceAccount 对象:(prometheus-rbac.yaml)
cat > prometheus-rbac.yaml <<EOF
apiVersion: v1
kind: ServiceAccount
metadata:
name: prometheus
namespace: monitoring
apiVersion: rbac.authorization.k8s.io/v1
kind: ClusterRole
metadata:
name: prometheus
rules:
- apiGroups:
- ""
resources:
- nodes
- services
- endpoints
- pods
- nodes/proxy
verbs:
- get
- list
- watch
- apiGroups:
- ""
resources:
- configmaps
- nodes/metrics
verbs:
- get
- nonResourceURLs:
- /metrics
verbs:
- get
apiVersion: rbac.authorization.k8s.io/v1beta1
kind: ClusterRoleBinding
metadata:
name: prometheus
roleRef:
apiGroup: rbac.authorization.k8s.io
kind: ClusterRole
name: prometheus
subjects:
kind: ServiceAccount

name: prometheus

namespace: monitoring

EOF
由于要获取的资源信息,在每一个 namespace 下面都有可能存在,所以这里使用的是 ClusterRole 的资源对象,值得一提的是这里的权限规则声明中有一个nonResourceURLs的属性,是用来对非资源型 metrics 进行操作的权限声明,这个在以前很少遇到过,然后直接创建上面的资源对象即可:
kubectl create -f prometheus-rbac.yaml
现在就可以添加 promethues 的资源对象了
kubectl create -f prometheus-deploy.yaml
Pod 创建成功后,为了能够在外部访问到 prometheus 的 webui 服务,我们还需要创建一个 Service 对象:(prometheus-svc.yaml)
cat > prometheus-svc.yaml <<EOF

apiVersion: v1

kind: Service

metadata:

name: prometheus

namespace: monitoring

labels:

app: prometheus

spec:

selector:

app: prometheus

type: NodePort

ports:
name: web

port: 9090

targetPort: http

nodePort: 32501

EOF
为了方便测试,我们这里创建一个NodePort类型的服务,当然也可以创建一个IngressRoute对象,通过域名来进行访问:
kubectl create -f prometheus-svc.yamlkcs -A | grep prometheus
monitoring prometheus NodePort 10.97.135.241 <none> 9090:32501/TCP 48s
然后我们就可以通过http://任意节点IP:32501访问 prometheus 的 webui 服务了
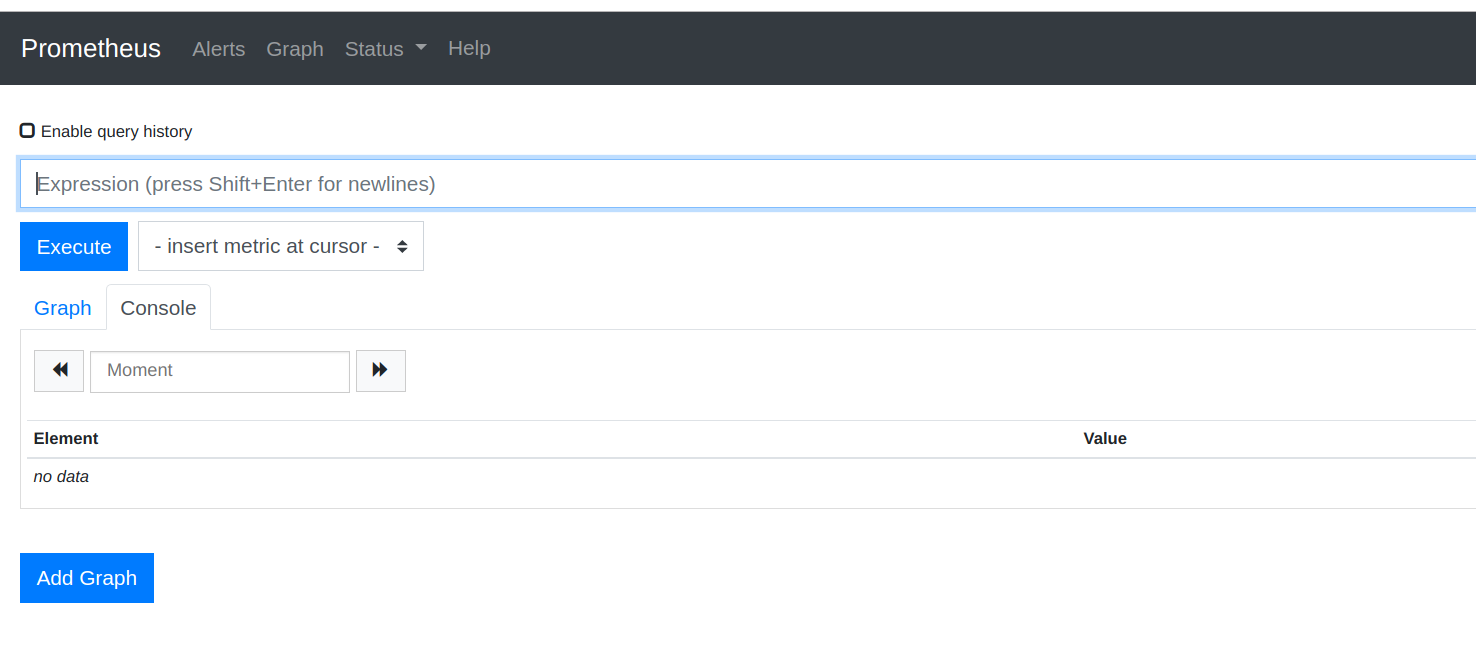
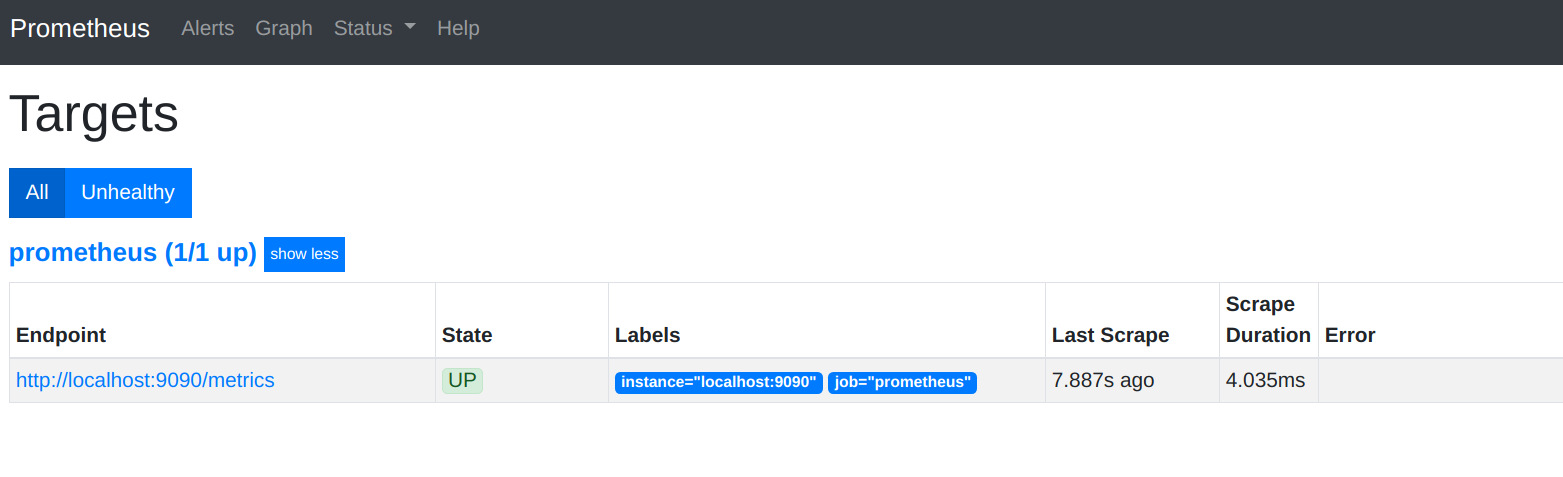
查看监控到的targets
除了简单的直接使用采集到的一些监控指标数据之外,这个时候也可以使用强大的 PromQL 工具,PromQL其实就是 prometheus 便于数据聚合展示开发的一套 ad hoc 查询语言的,你想要查什么找对应函数取你的数据好了.