大家好,我是邓飞,对于动植物育种而言,我之前写过PRS和MAS以及GS的关系,有老师评论说PRS更类似GS,因为它可以利用已有的GWAS信息,直接预测候选群的表型,如果按照动植物的GS方法,几十万几百万的样本做GS显然不现实,而PRS提供了这种思路,就可以利用已有的GWAS结果,通过一些质控,来预测候选群的表现(目标群体的风险得分)。
当然,这里的PRS,是多基因风险得分,是预测疾病的表现,而PGS(多基因得分)更中性一点。总结如下:
- 1,如果选择显著性的点,位点少时,就可以预测只有基因型的候选群,这就是动植物的分子标记辅助选择(MAS)
- 2,如果使用所有位点,选择最优的组合,预测只有基因型的候选群,就是动植物中的基因组选择(GS)
- 3,相对于MAS和GS,PRS模型,可以考虑位点的LD质控,特别是位点少的MAS,更准确
关于PRS系列文章中,上篇博客,介绍了PRSice软件计算二分类性状的PRS得分,本次介绍连续性状的PRS得分计算方法。
我们先把流程跑通,然后看数据质控,PCA等协变量加入加入,LD衰减等内容。
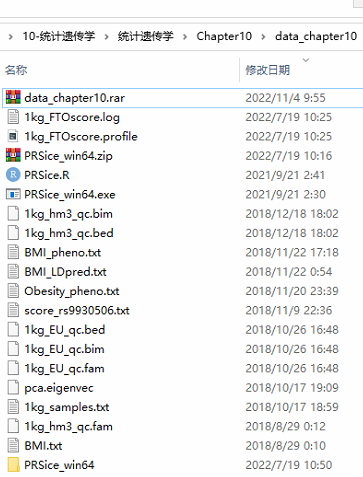
1. 数据
数据来源《统计遗传学》第十章节:

2. 环境配置
这里使用Linux系统,使用PRSice-2.0 软件。首先把数据放到Linux系统中,把可执行文件PRSice软件放到同一个文件夹中:
「注意,本操作也可以用windows系统实现,需要下载对应的PRSice-2.0 的windows版本!」
$ ls
1kg_EU_qc.bed  1kg_FTOscore.log      1kg_hm3_qc.bim   BMI_LDpred.txt  Obesity_pheno.txt  PRSice.R
1kg_EU_qc.bim  1kg_FTOscore.profile  1kg_hm3_qc.fam   BMI_pheno.txt   pca.eigenvec       score_rs9930506.txt
1kg_EU_qc.fam  1kg_hm3_qc.bed        1kg_samples.txt  BMI.txt         PRSice_linux
3. base和target数据
3.1 base data
这里的base data是连续性状的GWAs结果,文件:BMI.txt

「文件有行头名,每一列分别是:」
- SNP名称
- A1,次等位基因
- A2,主等位基因
- Beta,effect效应值
- Pval,P值
「共有2336370个SNP的GWAS结果。」
$ wc -l BMI.txt

2336270 BMI.txt
3.2 target data
首先目标数据是二进制的plink文件:1kg_hm3_qc:
$ ls 1kg_hm3_qc.*

1kg_hm3_qc.bed  1kg_hm3_qc.bim  1kg_hm3_qc.fam
目标数据中,共有1092个样本,每个样本有846484个位点。
$ wc -l 1kg_hm3_qc.fam

1092 1kg_hm3_qc.fam

$ wc -l 1kg_hm3_qc.bim

846484 1kg_hm3_qc.bim
然后是目标文件的表型数据:BMI_pheno.txt
$ head BMI_pheno.txt

FID IID BMI

0 HG00096 25.022827

0 HG00097 24.853638

0 HG00099 23.689295

0 HG00100 27.016203

0 HG00101 21.461624

0 HG00102 20.673635

0 HG00103 25.71508

0 HG00104 25.252243

0 HG00106 22.765049
4. 运行模型
注意,原始数据BMI.txt文件中,有9行是重复的行,所以用uniq去重一下:
uniq BMI.txt >t.txt

mv t.txt BMI.txt
「运行模型:」
Rscript PRSice.R --dir . --prsice ./PRSice_linux --base BMI.txt --target 1kg_hm3_qc --snp MarkerName --A1 A1 --A2 A2 --stat Beta --pvalue Pval --pheno-file BMI_pheno.txt --bar-levels 1 --fastscore --binary-target F --out BMI_score_all
代码解释
- Rscirpt,是系统中的R脚本调用
- PRSice.R是下载的软件
- --prsice ,是指定PRSice版本,这里是PRSice_linux
- --base,基础数据,这里是GWAS的结果
- --target,是目标数据,这里是plink的二进制文件前缀名
- --snp,是gwas结果中的snp名称,根据实际文件名写
- --A1,gwas的行头名,根据实际文件名写
- --A2,gwas的行头名,根据实际文件名写
- --stat,gwas的行头名,根据实际文件名写,对应的是效应值
- --pvalue,gwas的行头名,根据实际文件名写,对应的是P值
- --pheno,是目标数据的表型数据,三列:FID,IID,表型数据
- --bar-levels 1,默认是使用所有的SNP进行PRS的计算
- --fastscore,计算PRS得分
- --binary-target F,是连续性状
- --out BMI_socre_all,输出文件名。
日志:
$ Rscript PRSice.R --dir . --prsice ./PRSice_linux --base BMI.txt --target 1kg_hm3_qc --snp MarkerName --A1 A1 --A2 A2 --stat Beta --pvalue Pval --pheno-file BMI_pheno.txt --bar-levels 1 --fastscore --binary-target F --out BMI_score_all
PRSice 2.3.3 (2020-08-05)
https://github.com/choishingwan/PRSice
(C) 2016-2020 Shing Wan (Sam) Choi and Paul F. O'Reilly
GNU General Public License v3
If you use PRSice in any published work, please cite:
Choi SW, O'Reilly PF.
PRSice-2: Polygenic Risk Score Software for Biobank-Scale Data.
GigaScience 8, no. 7 (July 1, 2019)
2022-11-04 10:51:48
./PRSice_linux
--a1 A1
--a2 A2
--bar-levels 1
--base BMI.txt
--beta
--binary-target F
--clump-kb 250kb
--clump-p 1.000000
--clump-r2 0.100000
--fastscore
--num-auto 22
--out BMI_score_all
--pheno BMI_pheno.txt
--pvalue Pval
--seed 1715667869
--snp MarkerName
--stat Beta
--target 1kg_hm3_qc
--thread 1Initializing Genotype file: 1kg_hm3_qc (bed)
Start processing BMI
Base file: BMI.txt
Header of file is:
MarkerName A1 A2 Beta PvalReading 100.00%
2336260 variant(s) observed in base file, with:
358378 ambiguous variant(s) excluded
1977882 total variant(s) included from base fileLoading Genotype info from target
1092 people (525 male(s), 567 female(s)) observed
1085 founder(s) included127366 variant(s) not found in previous data
719118 variant(s) includedPhenotype file: BMI_pheno.txt
Column Name of Sample ID: FID+IID
Note: If the phenotype file does not contain a header, the
column name will be displayed as the Sample ID which is
expected.There are a total of 1 phenotype to process
Start performing clumping
Clumping Progress: 100.00%
Number of variant(s) after clumping : 117278Processing the 1 th phenotype
BMI is a continuous phenotype
1085 sample(s) with valid phenotypeStart Processing
Processing 100.00%
There are 1 region(s) with p-value less than 1e-5. Please
note that these results are inflated due to the overfitting
inherent in finding the best-fit PRS (but it's still best
to find the best-fit PRS!).
You can use the --perm option (see manual) to calculate an
empirical P-value.Begin plotting
Current Rscript version = 2.3.3
Plotting Bar Plot
从日志可以看出,PRSice软件,分别执行下面的步骤:
- base数据汇总,进行了质控,剩余1977882个位点
- target文件中,共有1092个个体,其中525个Male,567个female,共有719118个交叉的位点
- 执行clumping,有效个体1085,有效位点117278
5. 结果说明
结果文件:

「整个模型的结果:」
最优模型是:117278个位点组成的模型,PRS解释百分比是13.8%,P值是7e-37(极显著)

「每个个体的PRS得分:」
$ head BMI_score_all.best

FID IID In_Regression PRS

0 HG00096 Yes -2.50012794e-05

0 HG00097 Yes -3.7721909e-05

0 HG00099 Yes -3.15140097e-05

0 HG00100 Yes -3.08681086e-05

0 HG00101 Yes -3.65507599e-05

0 HG00102 Yes -3.56626993e-05

0 HG00103 Yes -2.73137334e-05

0 HG00104 Yes -2.35918077e-05

0 HG00106 Yes -2.38714852e-05
可视化:

6. 梯度阈值
增加--bar-levels的梯度,分别是:
- 5e-8
- 5e-7
- 5e-6
- 5e-5
- 5e-4
- 5e-3
- 5e-2
- 5e-1
代码:
Rscript PRSice.R --dir . --prsice ./PRSice_linux --base BMI.txt --target 1kg_hm3_qc --snp MarkerName --A1A1 --A2 A2 --stat Beta --pvalue Pval --pheno-file BMI_pheno.txt --bar-levels 5e-8,5e-7,5e-6,5e-5,5e-4,5e-3,5e-2,5e-1 --fastscore --binary-targetF --out BMI_thresholds
结果:

整体结果:BMI_thresholds.summary
最优的阈值是0.5,最优的位点数是90384,解释百分比是13.99%

看一下每个阈值对应的SNP个数以及解释百分比和对应的P值:BMI_thresholds.prsice

在这里插入图片描述
每个个体最优的PRS值:
$ head BMI_thresholds.best

FID IID In_Regression PRS

0 HG00096 Yes -3.24349447e-05

0 HG00097 Yes -4.97621266e-05

0 HG00099 Yes -4.11754297e-05

0 HG00100 Yes -4.15040277e-05

0 HG00101 Yes -4.79216457e-05

0 HG00102 Yes -4.70924063e-05

0 HG00103 Yes -3.56921583e-05

0 HG00104 Yes -3.0351058e-05

0 HG00106 Yes -3.19768991e-05
结果可视化:

看到这里,我有一个大胆的想法:
- 1,如果选择显著性的点,位点少时,就可以预测只有基因型的候选群,这就是动植物的分子标记辅助选择(MAS)
- 2,如果使用所有位点,选择最优的组合,预测只有基因型的候选群,就是动植物中的基因组选择(GS)
相对于MAS和GS,PRS模型,可以考虑位点的LD质控,特别是位点少的MAS,更准确。