感谢读友苏千叶的投稿分享!
由于研究的需要,需要求解势函数从而得到散度风、旋度风。Python的windspharm库可以实现以上功能。故记录下来分享给大家。
安装
windspharm库是在pyspharm库基础上写出来的,windspharm库中的大部分计算依赖pyspharm库,所以要使用windspharm库就也要安装pyspharm库。但是这两个库的安装有点麻烦,详细教程如下。
step1:安装windspharm库
- • 进入windspharm库作者的Github下载 下载链接:https://ajdawson.github.io/windspharm/latest/index.html
- • 下载以后解压出来复制文件夹的路径
- • 打开Anaconda Prompt
- • cd 文件夹路径 回车
- • 之后python setup.py即可安装成功
step2:安装pyspharm库(参考葉读春秋)
- • 在Anaconda Prompt输入pip debug --verbose查看python版本
- • 我们在如下链接中找到pyspharm库对应的版本进行下载。由于我使用的是Python3.9版本,所以下载pyspharm-1.0.9-cp39-cp39-win_amd64.whl 下载链接:https://www.lfd.uci.edu/~gohlke/pythonlibs/#pyspharm
- • 下载以后如果安装windspharm库之后Anaconda Prompt没有关闭,则将下载下来的whl文件放进上述windspharm路径之后pip install pyspharm-1.0.9-cp39-cp39-win_amd64.whl即可。
- • 如关闭,则重复上述指令,Anaconda Prompt会提示你Anaconda的根目录所在位置,将whl文件放进上述文件夹,重复pip install即可
注意:同时该库对numpy库的版本有要求,如报错可以试着更新numpy库
使用
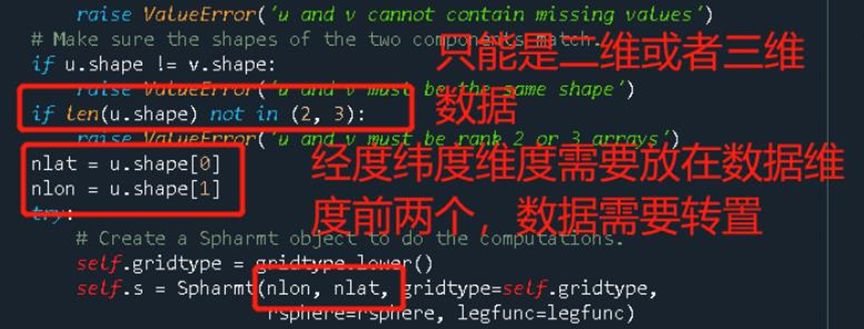
根据如下源码可知:该库存在一个巨大的缺陷,缺陷就是该库需要传入全球的风场数据,同时只能是二维或者三维的数据,且不能有nan值,否则使用的时候会报错,这是这个库的局限性,而且如果对数据进行区域切片后传入计算,那么计算结果会有巨大差异,导致不准确,所以说需要全球的风场数据。

这里提供使用范例:
step1:将我们的u,v调整至适合的输入形式
我们前面提到经纬度的维度需要放在数据前两个维度,windspharm提供了改变数组形状以及恢复形状的函数prep_data以及recover_data
from windspharm.tools import prep_data,recover_data
u, infou = prep_data(u, 'tzyx')

v, infov = prep_data(v, 'tzyx')
如准备一个维度为 (12、17、73、144) 的数组,其中维度为 (时间t,高度层z,纬度y,经度x),字符“x”和“y”分别表示经度和纬度,这两个维度和字符串务必保持对齐!!!
prep_data函数会返回需要的数组以及恢复数据所需的字典。
step2:导入VectorWind类,传入u,v实例化
from windspharm.standard import VectorWind
w = VectorWind(u, v)
step3:计算旋度风并恢复数组形状
upsi, vpsi = w.nondivergentcomponent()

upsi = recover_data(upsi, infou)

vpsi = recover_data(vpsi, infov)
step4:求绝对涡度 还有梯度等
absvrt = w.absolutevorticity()

absvrt_u, absvrt_v = w.gradient(absvrt)
官网案例
import cartopy.crs as ccrs
import matplotlib as mpl
import matplotlib.pyplot as plt
import xarray as xrfrom windspharm.xarray import VectorWind
from windspharm.examples import example_data_pathmpl.rcParams['mathtext.default'] = 'regular'
Read zonal and meridional wind components from file using the xarray module.
The components are in separate files.
ds = xr.open_mfdataset([example_data_path(f)
for f in ('uwnd_mean.nc', 'vwnd_mean.nc')])
uwnd = ds['uwnd']
vwnd = ds['vwnd']Create a VectorWind instance to handle the computation of streamfunction and
velocity potential.
w = VectorWind(uwnd, vwnd)
Compute the streamfunction and velocity potential.
sf, vp = w.sfvp()
Pick out the field for December.
sf_dec = sf[sf['time.month'] == 12]
vp_dec = vp[vp['time.month'] == 12]Plot streamfunction.
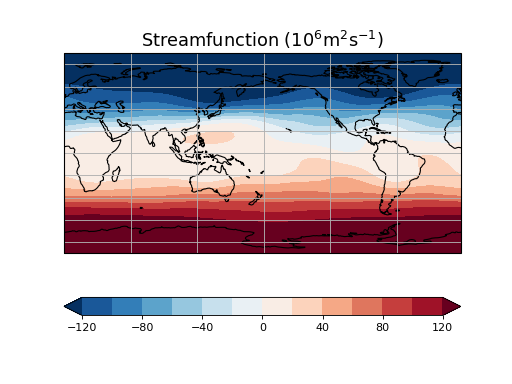
clevs = [-120, -100, -80, -60, -40, -20, 0, 20, 40, 60, 80, 100, 120]
ax = plt.subplot(111, projection=ccrs.PlateCarree(central_longitude=180))
sf_dec *= 1e-6
fill_sf = sf_dec[0].plot.contourf(ax=ax, levels=clevs, cmap=plt.cm.RdBu_r,
transform=ccrs.PlateCarree(), extend='both',
add_colorbar=False)
ax.coastlines()
ax.gridlines()
plt.colorbar(fill_sf, orientation='horizontal')
plt.title('Streamfunction ($10^6m^2s^{-1}$)', fontsize=16)Plot velocity potential.
plt.figure()
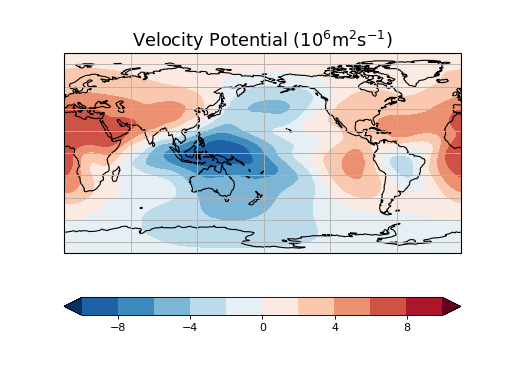
clevs = [-10, -8, -6, -4, -2, 0, 2, 4, 6, 8, 10]
ax = plt.subplot(111, projection=ccrs.PlateCarree(central_longitude=180))
vp_dec *= 1e-6
fill_vp = vp_dec[0].plot.contourf(ax=ax, levels=clevs, cmap=plt.cm.RdBu_r,
transform=ccrs.PlateCarree(), extend='both',
add_colorbar=False)
ax.coastlines()
ax.gridlines()
plt.colorbar(fill_vp, orientation='horizontal')
plt.title('Velocity Potential ($10^6m^2s^{-1}$)', fontsize=16)
plt.show()


