“大家好,我是南南,这是南南2022暑假的第二篇推文
数据下载
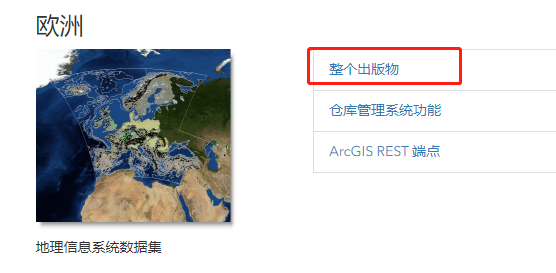
你可以通过下方网站来获取,世界地质图
https://certmapper.cr.usgs.gov/data/apps/world-maps/
在这里你可以以Shapefile格式下载来自世界各个地区的地质图

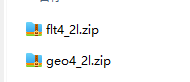
当然,一些其他的例如断层,构造等信息,这非常简单,下方是我下载好的土耳其地质数据
数据处理
分析数据
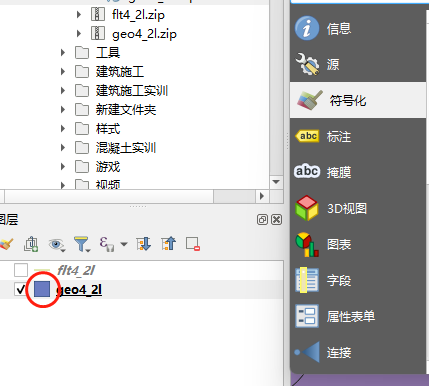
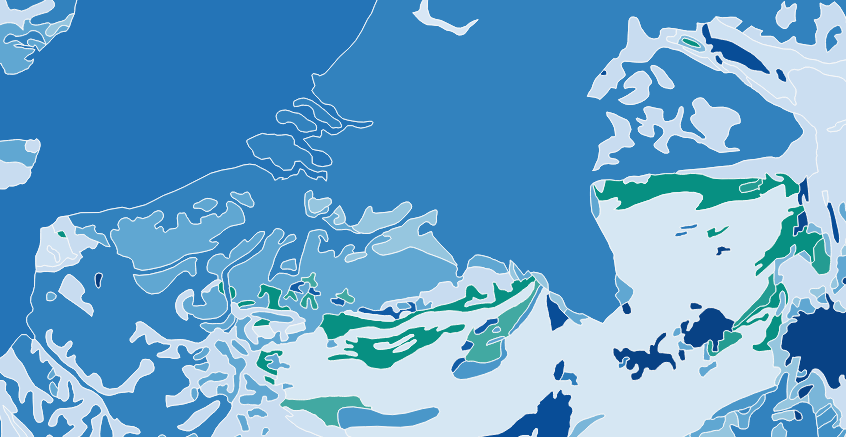
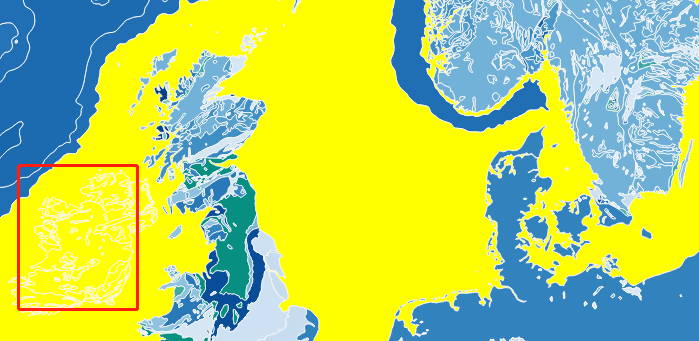
打开qgis,加载数据,在这其中geo4-2l表示的是广义地质文件,flt4_2l表示的是
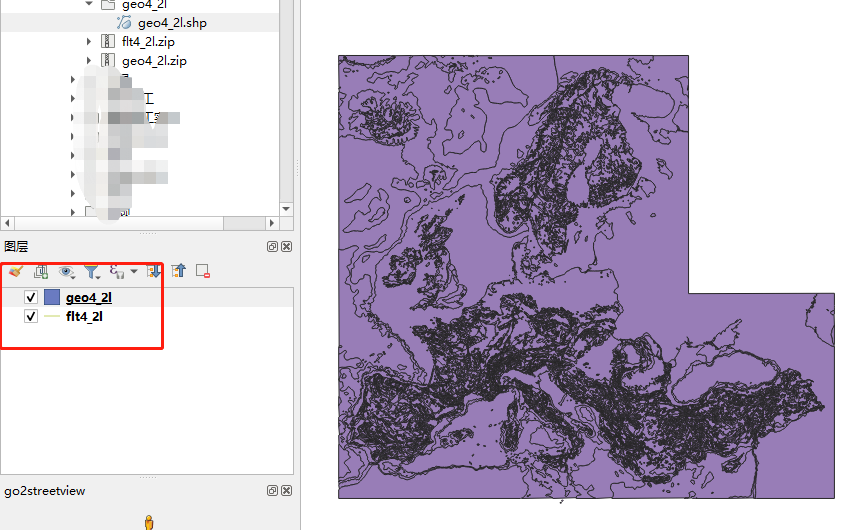
我们可以看到在这份数据上有很多的多边形,如果你想知道他们代表什么含义,你可以使用识别工具来一个个查看
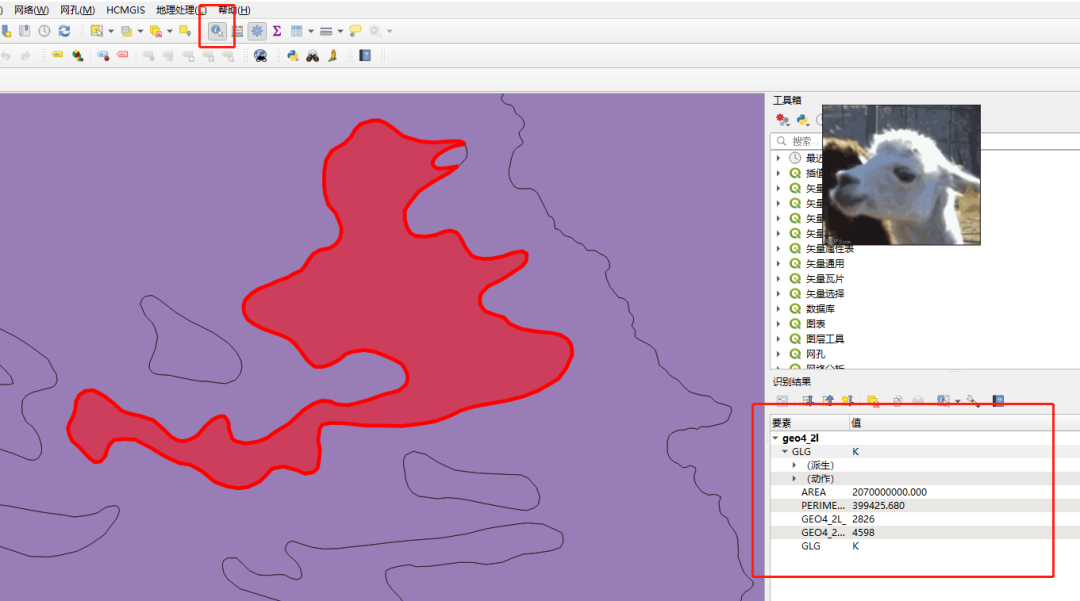
但是如果你想查看总体的数据,这个可能不太行,你可以尝试在内容窗格的图层上右击,选择属性表查看
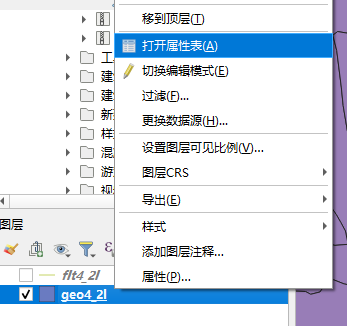
不过我想你们对于这个全是英文的属性表很难感兴趣,虽然看不懂,但我们可以尝试着推断一下
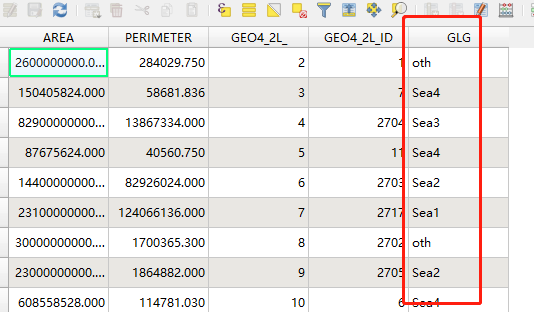
好吧我猜不出来,也许是地质类型?不猜了,我们可以在之前的网站上找到关于这些属性的介绍
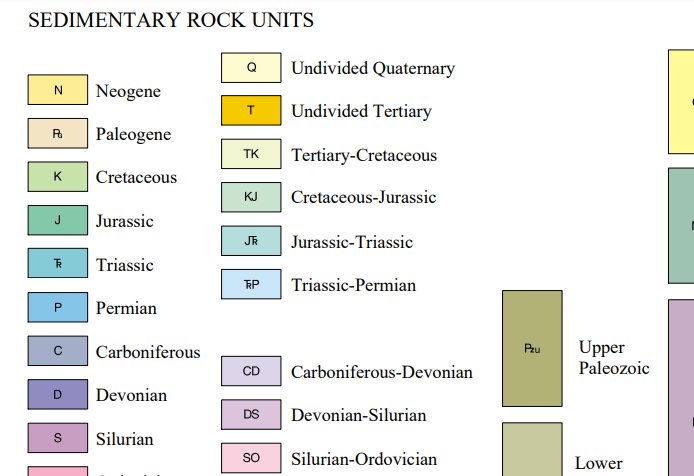
他们都在这份简短的报告里,
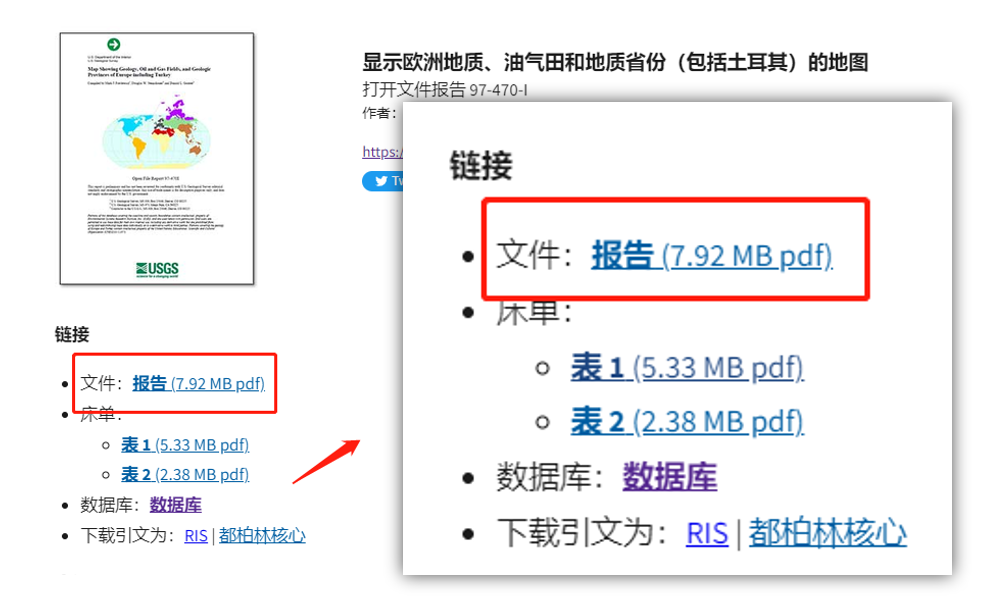
打开这些报告,你可以看到属性所对应的专业名词,变质岩这些,抱歉我地质学早还给老师了
符号化
“好吧,让我们回到qgis,如果你想根据不同的岩石类型来制作这份地质图,我们就需要给他分类设色
双击图层前方的符号打开属性,选择符号化
上传改成分类,选择相应的字段
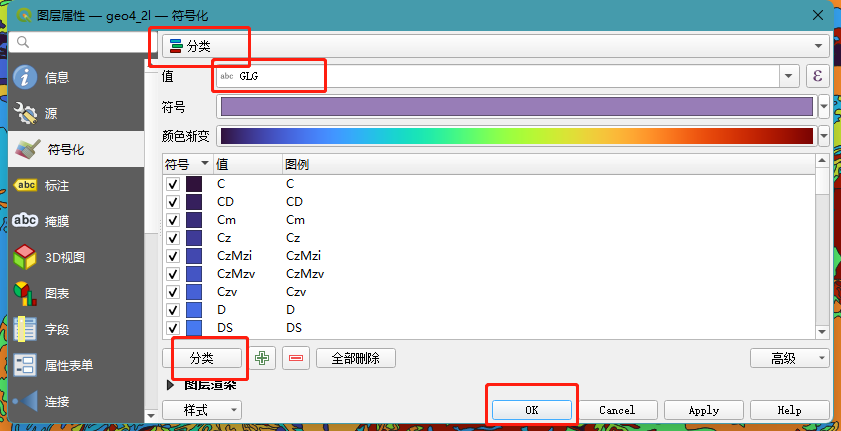
效果如下
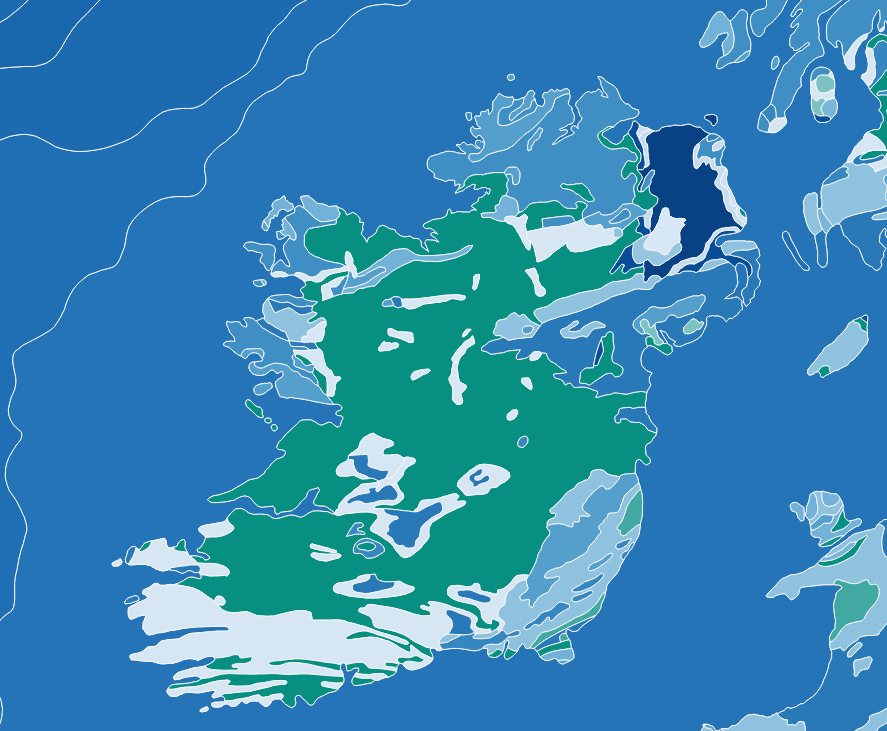
定义投影
如果你细心的话,你应该可以发现,地图的右下角坐标系是未知,这意味着动态投影真正选择,所以我们需要给他定义一个投影(要不然添加比例尺的时候会很有趣)
“点击右下角的未知即可进入定义投影界面
选择地区
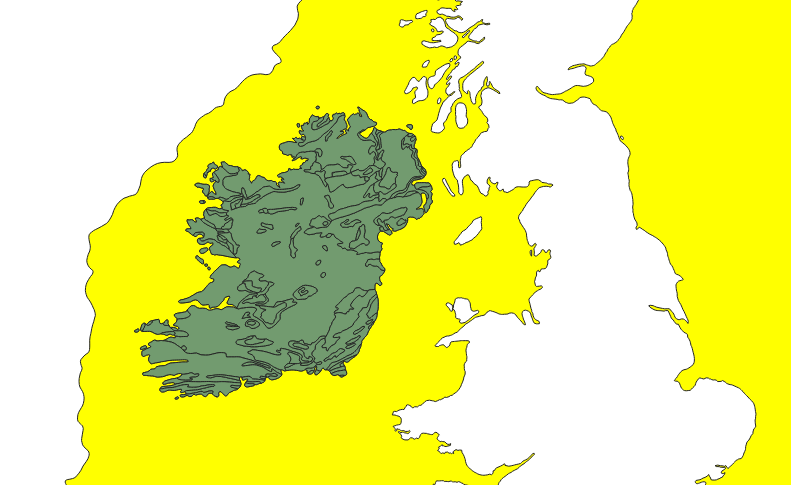
在制图过程中我们实际上并不需要这么大的地区,仅需要一个国家或者省,接下来如果你有对应地区的数据可以直接裁剪,以此来提取该地质图的一部分
“问题又来了,我没有,所以我就随便找块地给你们演示了
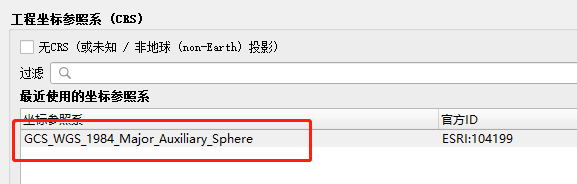
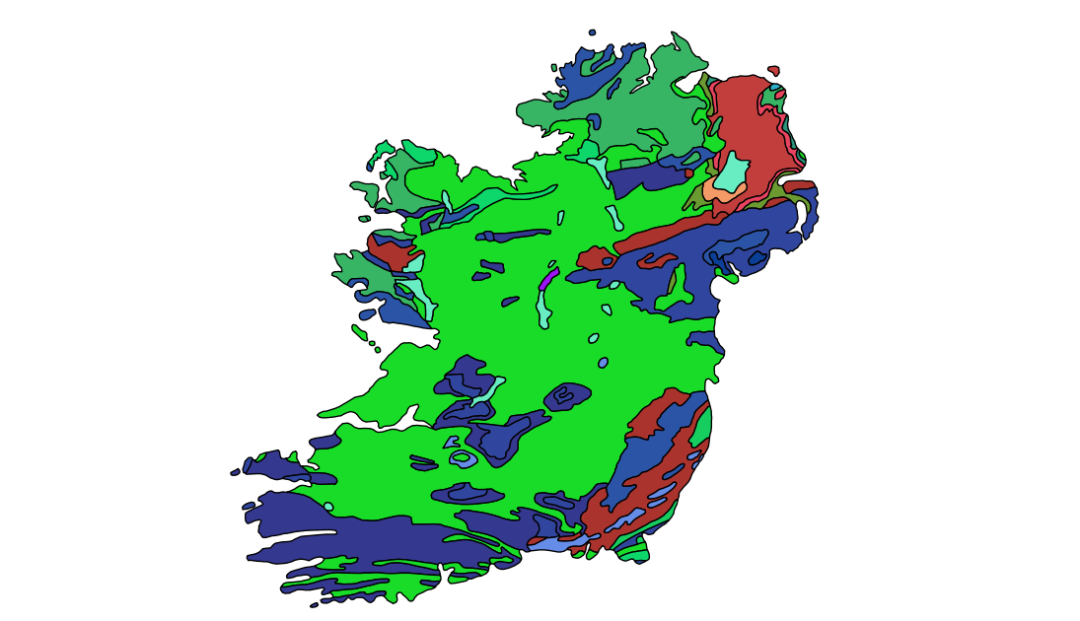
下面这个应该是个岛,就用它吧
手绘选择

选择结果如下
不用担心,先导出数据
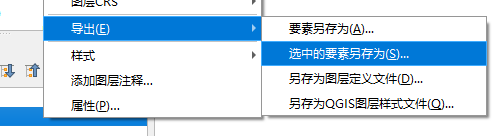
岛外的地区是个整体,我们可以很轻松的选择他,然后删除
打开数字化工具栏的切换编辑模式,类似于arcgis的编辑器,然后delete,就可以删除选中的要素了
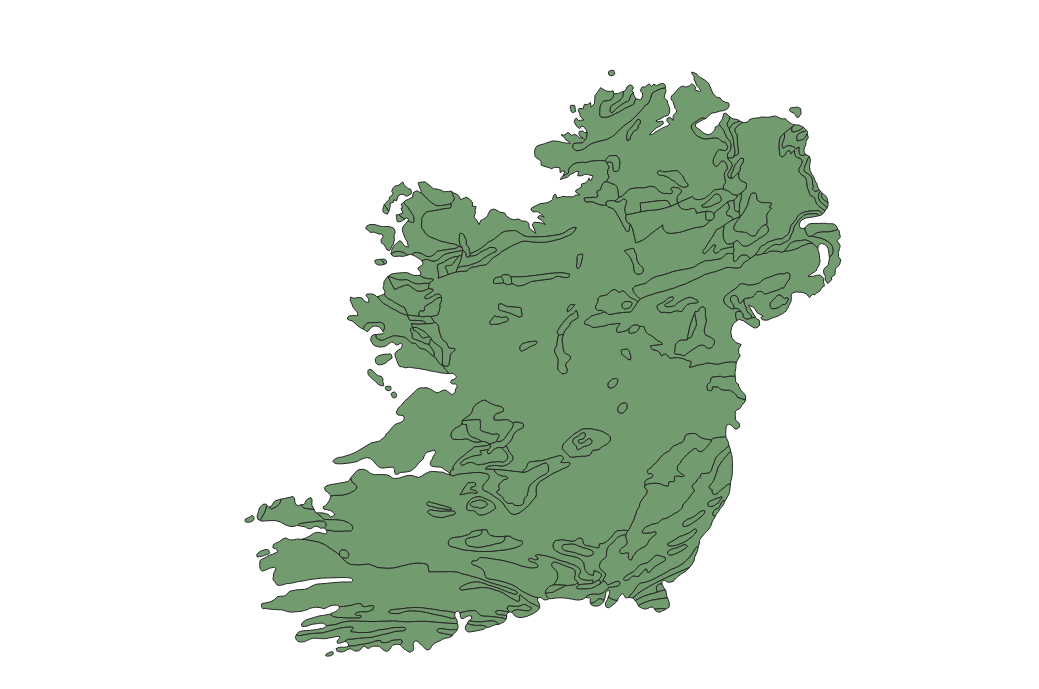
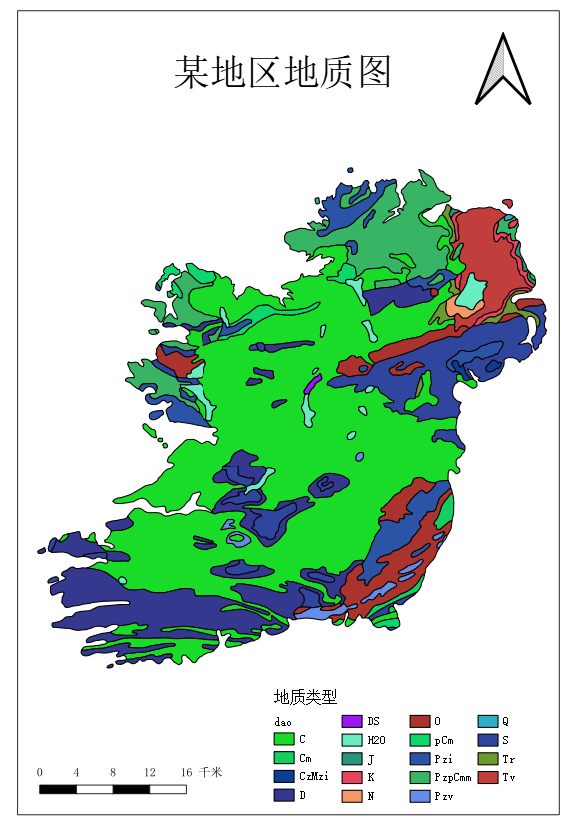
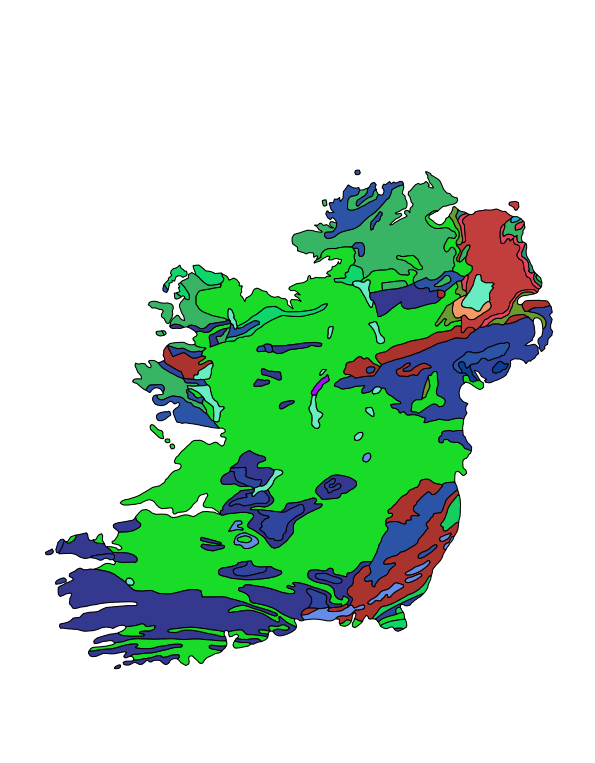
他太丑了,按照之前的方法对glg字段进行分类设色
地图布局
建立布局
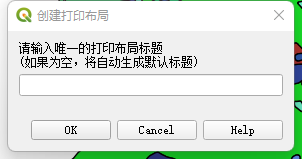
接下来开始进入布局制图吧,工程——新建打印布局
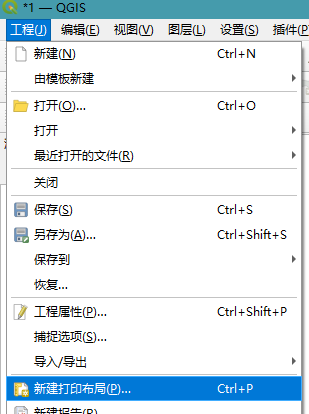
直接ok吧
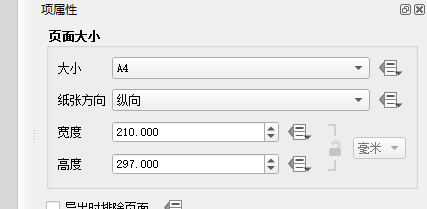
进入之后你可以在地图画板上右键单击,来更改页面属性,比如纸张大小这些
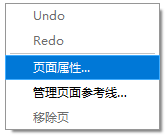
因为这个岛是竖着的,所以我将纸张方向改为了竖向
选择添加地图按钮添加地图
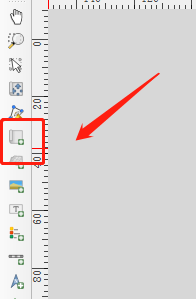
在地图画板上画一个矩形,如果第一次掌握不好你也可以在之后通过旁边的边界线修改矩形范围
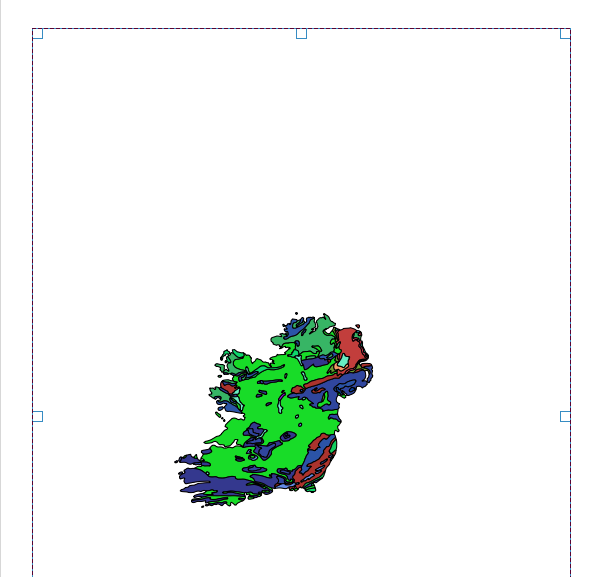
如果你此时移动,你会发现你移动的是这个矩形布局,而不是这里面的地图,单击左侧工具栏的移动项内容按钮即可移动地图

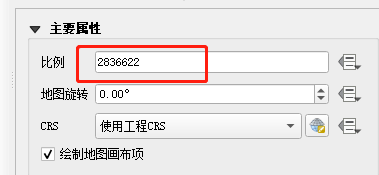
试着调整一下大小,让他看起来比例更加协调
有些时候用滚轮调整不是过大就是过小,所以我建议你可以通过更改右侧工具栏的比例来进行细微的调整
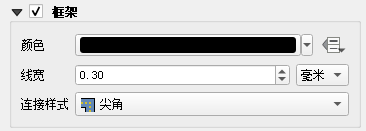
添加整饰要素
下拉,给地图添加一个边框
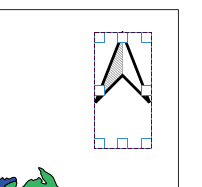
添加指北针,比例尺,图例
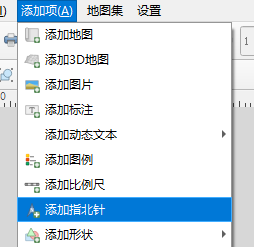
指北针
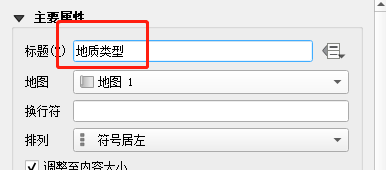
添加图例

标题可以在这里输入
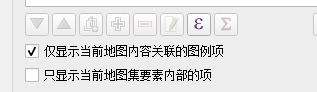
仅显示该图层所具有的图例
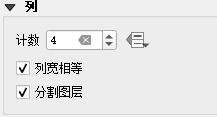
可以根据不同的布局对图例分列展示
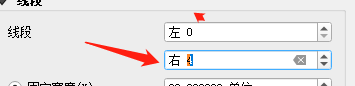
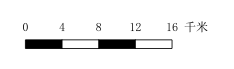
比例尺
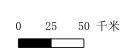
你可以在这里选择增加段的数量
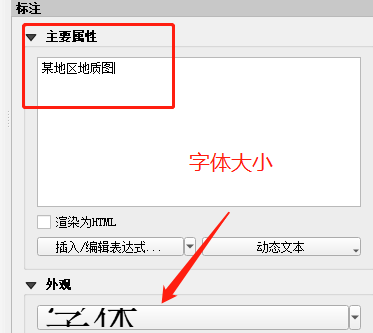
添加标题
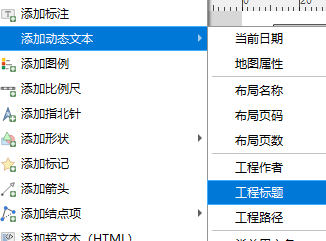
字体内容和大小在这里更改
这样一副标准的地图就差不多制作完成了