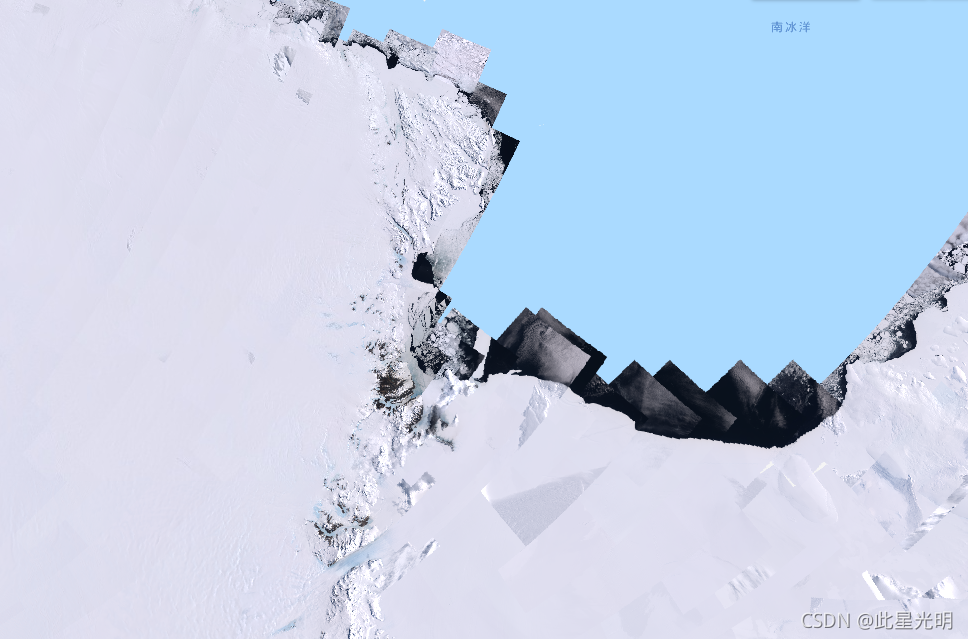
Landsat Image Mosaic of Antarctica (LIMA) - Processed Landsat Scenes (16 bit)
The Landsat Image Mosaic of Antarctica (LIMA) is a seamless and virtually cloudless mosaic created from processed Landsat 7 ETM+ scenes.
Processed Landsat Scenes (16 bit) are Level 1Gt NLAPS scenes converted to 16 bit, processed with sun-angle correction, and converted to reflectance values (Bindschadler 2008).
Each Landsat scene is processed with elevation data and sun-angle correction to ensure surface features were accurately represented. The sun's angle in Antarctica gives the appearance of a setting sun. Because of the low sun angle, as Landsat passes over Antarctica, the outer edges of the continent appear brighter than areas closer to the South Pole, so scenes have bright and dark areas. Inconsistent sun angles and shadows where corrected for these scenes. Without this process, mosaicking would produce a patchwork of scenes since each scene would have a brighter and a darker side.
Users can find individual image metadata available as a table at: USGS/LIMA/SR_METADATA
南极洲大地卫星图像马赛克(LIMA)是一个无缝的、几乎无云的马赛克,由经过处理的大地卫星7 ETM+场景创建。
经过处理的Landsat场景(16位)是将1Gt NLAPS场景转换为16位,用太阳角度校正处理,并转换为反射值(Bindschadler 2008)。
每个Landsat场景都经过高程数据和太阳角度校正的处理,以确保准确表达地表特征。南极洲的太阳角度给人一种夕阳的感觉。由于太阳角度很低,当Landsat经过南极洲时,大陆的外缘比靠近南极的地区显得更亮,所以场景中有明亮的地方,也有黑暗的地方。在这些场景中,不一致的太阳角度和阴影得到了纠正。如果没有这个过程,镶嵌会产生一个拼凑的场景,因为每个场景都有一个较亮和一个较暗的一面。
用户可以在以下网站上找到单个图像的元数据表。usgs/lima/sr_metadata
Dataset Availability
1999-06-30T00:00:00 - 2002-09-04T00:00:00
Dataset Provider
USGS
Collection Snippet
Copied
ee.ImageCollection("USGS/LIMA/SR")
Bands Table
Name | Description | Resolution | Wavelength |
|---|---|---|---|
B1 | Blue | 30 meters | 0.45 - 0.52 µm |
B2 | Green | 30 meters | 0.52 - 0.60 µm |
B3 | Red | 30 meters | 0.63 - 0.69 µm |
B4 | Near infrared | 30 meters | 0.77 - 0.90 µm |
B5 | Shortwave infrared 1 | 30 meters | 1.55 - 1.75 µm |
B7 | Shortwave infrared 2 | 30 meters | 2.08 - 2.35 µm |
B8 | Panchromatic | 15 meters | 0.52 - 0.90 µm |
代码:
var dataset = ee.ImageCollection('USGS/LIMA/SR');
var antarctica = dataset.select(['B3', 'B2', 'B1']);
var antarcticaVis = {
  min: 0.0,
  max: 10000.0,
};
Map.setCenter(164.619, -77.99, 7);
Map.addLayer(antarctica, antarcticaVis, 'Antartica Imagery (RGB)');