这次我们使用全球NOAA数据来做一下简单的线性分析:NOAA CDR AVHRR NDVI: Normalized Difference Vegetation Index, Version 5提示,这个数据只适用于大尺度的分析,洲际或者全球的可以进行。
NDVI | Normalized difference vegetation index | -9998 | 9998 | 0.0001 |
|---|
NOAA气候数据记录(CDR)的AVHRR归一化植被指数(NDVI)包含从NOAA AVHRR表面反射产品中得到的网格化的每日NDVI。它提供了地表植被覆盖活动的测量,网格化的分辨率为0.05°,并在全球范围内计算陆地表面。
这里需要用到一个函数:
difference(start, unit) 返回两个Date在指定单位中的差值;结果是浮点的,基于单位的平均长度。
参数。 this:date (Date) start (Date) 单位(字符串)。 年"、"月"、"周"、"日"、"小时"、"分钟 "或 "秒 "中的一个。
返回。浮点数
这里用difference就是为了确定两个时间节点内的时间差,也就是确定时间范围,本实验用到的是以年为单位进行计算。
//map所需年份的函数 function createTimeBand(img) { var year = img.date().difference(ee.Date('1990-01-01'), 'year'); return ee.Image(year).float().addBands(img); }// 线性趋势
var collection = ee.ImageCollection("NOAA/CDR/AVHRR/NDVI/V5")
.select('NDVI')
.map(createTimeBand);
print(collection.limit(100))
var fit = collection.reduce(ee.Reducer.linearFit());// 展示影像
Map.addLayer(ee.Image(collection.select('NDVI').mean()),
{min: 0, max: 1},
'stable lights first asset');
Map.setCenter(30, 45, 4);
Map.addLayer(fit,
{min: 0, max: [0.18, 20, -0.18], bands: ['scale', 'offset', 'scale']},
'stable lights trend');
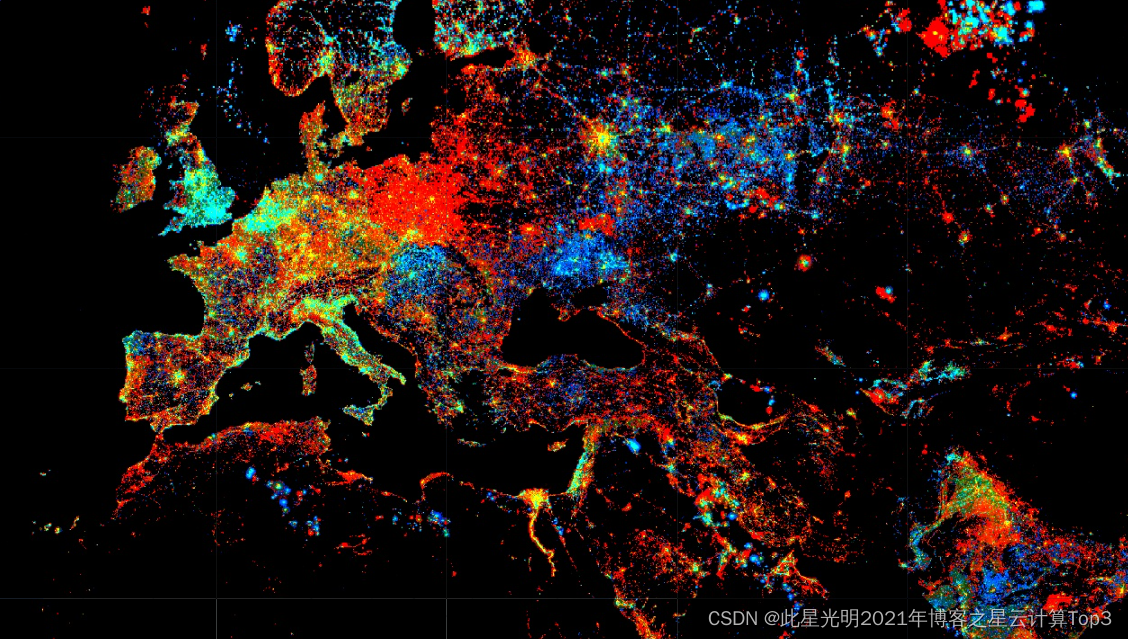
同样我们可以使用夜间灯光数据:
function createTimeBand(img) {
var year = img.date().difference(ee.Date('1990-01-01'), 'year');
return ee.Image(year).float().addBands(img);
}var collection = ee.ImageCollection('NOAA/DMSP-OLS/CALIBRATED_LIGHTS_V4')
.select('avg_vis')
.map(createTimeBand);
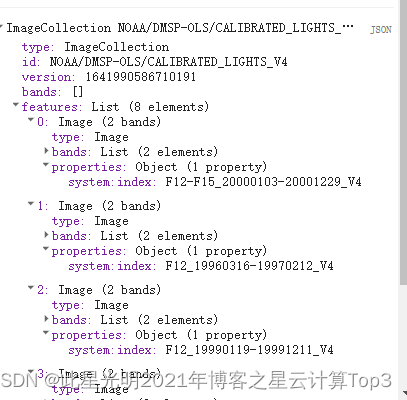
print(collection)
var fit = collection.reduce(ee.Reducer.linearFit());Map.addLayer(ee.Image(collection.select('avg_vis').first()),
{min: 0, max: 63},
'stable lights first asset');
// 显示趋势为红色/蓝色,亮度为绿色。
Map.setCenter(30, 45, 4);
Map.addLayer(fit,
{min: 0, max: [0.18, 20, -0.18], bands: ['scale', 'offset', 'scale']},
'stable lights trend');


这里NDVI影像参数需要设定,建议使用Landsat 年度数据,如果你要做的数据是月度,那么建议在第一个函数中用月来筛选,然后再collection中设定指定的年份即可。